
Almond nutrition: calculating the potassium and phosphorus requirement

Savvas Pastopoulos, Agronomist MSc, Pastopoulos Agronomics, Neos Mylotopos, Pella
The almond removes more potassium than nitrogen with the harvest. Even so, the commonest practice in Greek almond orchards remains a single winter compound fertiliser, which supplies potassium at the wrong season, phosphorus at four times the real requirement, and nitrogen at the moment when the tree takes up nothing from the soil. What follows calculates the real potassium and phosphorus requirements from yield, documented by five-year whole-tree excavation trials.
The Greek edition of this article works in stremmata; this English edition uses hectares throughout. 1 ha = 10 stremmata. Divide any figure below by ten for a per-stremma basis.
- Why the winter compound does not add up
- How many nutrients actually leave with the harvest
- The tree's reserves, the invisible fertiliser
- The seasonal uptake curve
- Calculating the potassium requirement
- Calculating the phosphorus requirement
- Soil analysis, which test and how it is read
- Leaf analysis and the critical July values
- The 1% potassium limit, a counter-intuitive finding
- Which potassium fertiliser, where and when
- Phosphorus on calcareous soils
- Hulls and shells back into the orchard
- Nitrogen, potassium and hull rot
- Foliar sprays, what the data show
- Water and nutrition, one does not substitute for the other
- An example annual programme
- What fertilisation does not solve
- Sources
1. Why the winter compound does not add up
The classic recipe is familiar: one broadcast of an 11-15-15 compound in winter, perhaps an additional nitrogen dressing in spring, and that is that. The problem is not that the practice is old. The problem is that it does not add up arithmetically.
A productive, irrigated almond orchard yielding 2,500 kg of kernel per hectare removes with the harvest about 228 kg of K2O and only 46 kg of P2O5 per hectare [6]. To cover the potassium with an 11-15-15 compound would take about 1,800 kg of product per hectare.
1,800 kg × 15% = 270 kg P2O5against a real requirement of 46 kg for the fruit plus 18 kg for tree growth, nearly four times as much phosphorus as is removed.
And it is not only the quantity. It is the timing. Whole-tree excavation trials showed that from bloom to fruit set there is no net uptake of nitrogen from the soil, the entire demand for leaf expansion, flowering and fruit set is met from the reserves of the perennial organs [3]. Nitrogen applied in December or January finds roots that are not asking for it, in soil that is draining under winter rain.
2. How many nutrients actually leave with the harvest
The basis of any serious fertiliser calculation is removal: how many kilos of each element physically leave the field with the product. For the almond the figures come from Patrick Brown's group at the University of California, which followed a commercial orchard over five years with fruit and leaf sampling and complete tree excavations [1].
| Element | Per tonne of kernel | As oxide |
|---|---|---|
| Nitrogen (N) | 65 to 68 kg | not reported |
| Phosphorus (P) | 8 to 9 kg | 18 to 20 kg P2O5 |
| Potassium (K) | 74 to 82 kg | 90 to 100 kg K2O |
The values cover the whole of the material leaving the orchard at harvest, kernel, shell, hull, and the leaves and twigs collected with them. Sources [5] [6], with the same ranges confirmed by Spanish studies [5].
The ratio is the most instructive element of the table: for every kilo of phosphorus that leaves, almost ten kilos of potassium leave. No commercial compound has that ratio, and none should be chosen as though it did.
Per hectare, from actual yield
With coefficients of 65 kg N, 18.4 kg P2O5 and 91.2 kg K2O per tonne of kernel [6], removal per hectare follows directly from the mean yield of the last three years.
| Yield (kg kernel/ha) | N (kg/ha) | P2O5 (kg/ha) | K2O (kg/ha) |
|---|---|---|---|
| 1,000 | 65 | 18 | 91 |
| 1,500 | 98 | 28 | 137 |
| 2,000 | 130 | 37 | 182 |
| 2,500 | 163 | 46 | 228 |
| 3,000 | 195 | 55 | 274 |
| 3,500 | 228 | 64 | 319 |
| 4,000 | 260 | 74 | 365 |
The growth of the tree itself
The fruit is not the only consumer. Every year the tree builds new wood, new roots, new scaffolds. In the same trial, at the optimum nitrogen level, the annual increment of the perennial organs was 44 kg N, 8 kg P, 38 kg K, 3.5 kg Ca and 2.8 kg Mg per hectare [1].
+44 kg N +18 kg P2O5 +46 kg K2O per hectareThis increment applies to orchards that are still filling their canopy. In a fully formed, mature orchard with a stabilised canopy volume this component becomes smaller.
3. The tree's reserves, the invisible fertiliser
The almond blooms before it puts out leaves. At the moment of bloom there is no photosynthetic surface, and no active uptake from roots in cold soil. Everything the flowers and the first leaves need comes from reserves laid down the previous year.
Those reserves were measured by successive trunk and scaffold sampling and by complete tree excavations in two consecutive years [3]. The nutrient content of the perennial organs is at a maximum during dormancy and reaches its minimum 12 to 14 days after full bloom, when the leaves have expanded 60 to 70%.
| Element | Reserve available for remobilisation (kg/ha) | When it is refilled |
|---|---|---|
| Nitrogen | 26.5 to 44.4 | From 41 days after bloom to complete leaf fall (249 days) |
| Phosphorus | 6.8 to 7.2 (mean) | From 98 days to complete leaf fall |
| Potassium | 24.4 to 30.8 (mean) | From 98 days to complete leaf fall |
| Sulphur | 1.3 to 1.6 | From 98 days to complete leaf fall |
| Boron | 0.1 to 0.2 | From 98 days to complete leaf fall |
Remobilised nitrogen covered 24 to 33% of the annual demand of the annual organs, and 100% of the demand between bloom and fruit set [3]. Potassium and phosphorus followed the same pattern: maximum storage in dormancy, remobilisation up to fruit set and the development of 70 to 100% of the canopy.
Where each element is stored
- Nitrogen, mainly in roots over one centimetre in diameter and in the canopy scaffolds; smaller quantities in the trunk and framework [3].
- Phosphorus, mainly in roots over one centimetre, in the canopy scaffolds and in branches under 2.5 centimetres.
- Potassium, mainly in the canopy scaffolds, in branches under 2.5 centimetres and in roots over one centimetre.
From senescing leaves, 11 to 15.5 kg of nitrogen and 8.9 to 20 kg of potassium per hectare return to the reserve, depending on the level of nitrogen fertilisation [3]. An interesting finding: potassium remobilisation from the leaves was greater in nitrogen-deficient trees and smaller in optimally fertilised ones, the tree recycles more intensively when it is short.
Sources: 3
4. The seasonal uptake curve
Timing matters more than total quantity, once the quantity is roughly right. The accumulation curves in the fruit were measured over four consecutive years, with days counted from full bloom [1].
| Element | At ~45 days | At ~85 days | At ~110 to 125 days | Character of the curve |
|---|---|---|---|---|
| Nitrogen | 33 to 55% | 67 to 83% | 86 to 93% | Rapid and early, all but finished by mid-season |
| Phosphorus | 30 to 47% | 53 to 66% | 67 to 86% | Almost linear throughout the period |
| Potassium | 24 to 40% | 45 to 61% | 66 to 73% | Late; ~30% goes in after 101 to 126 days |
| Calcium | not reported | not reported | 70 to 90% | Steady concentration until close to maturity |
| Magnesium | not reported | not reported | 70 to 85% | Parallel to calcium |
| Sulphur | not reported | not reported | >90% | Follows the nitrogen curve |
The point that changes a fertiliser programme is the last column of the potassium row. On average, at 111 days from bloom the fruit has accumulated 73 ± 4% of its final potassium [1]. The remaining quarter to third goes in between hull split and harvest.
Independent confirmation comes from the Mediterranean literature: an Italian review of almond eco-physiology reports that during shell hardening nitrogen uptake reaches 50% and potassium uptake 30% of the annual requirement [10].
Translated into a Greek calendar
In the Pella region full bloom usually falls between late February and mid-March, depending on cultivar and season. Taking 1 March as the starting point:
| Days from bloom | Indicative date | Phenological stage |
|---|---|---|
| 0 | 1 March | Full bloom |
| 12 to 14 | Mid-March | Reserve minimum, fruit set, 60 to 70% leaf expansion |
| 41 to 45 | Mid-April | Start of net nitrogen storage; full canopy |
| 85 to 90 | Late May | Shell hardening |
| 98 | Early June | Start of net potassium and phosphorus storage in the perennial organs |
| 110 to 125 | Mid to late June | Kernel filling |
| 150 to 180 | August | Hull split, harvest |
| 249 | Early November | Complete leaf fall, end of reserve loading |
The dates are indicative and shift with cultivar, altitude and season. The safe practice is to record the actual date of full bloom each year for each parcel and count days from there.
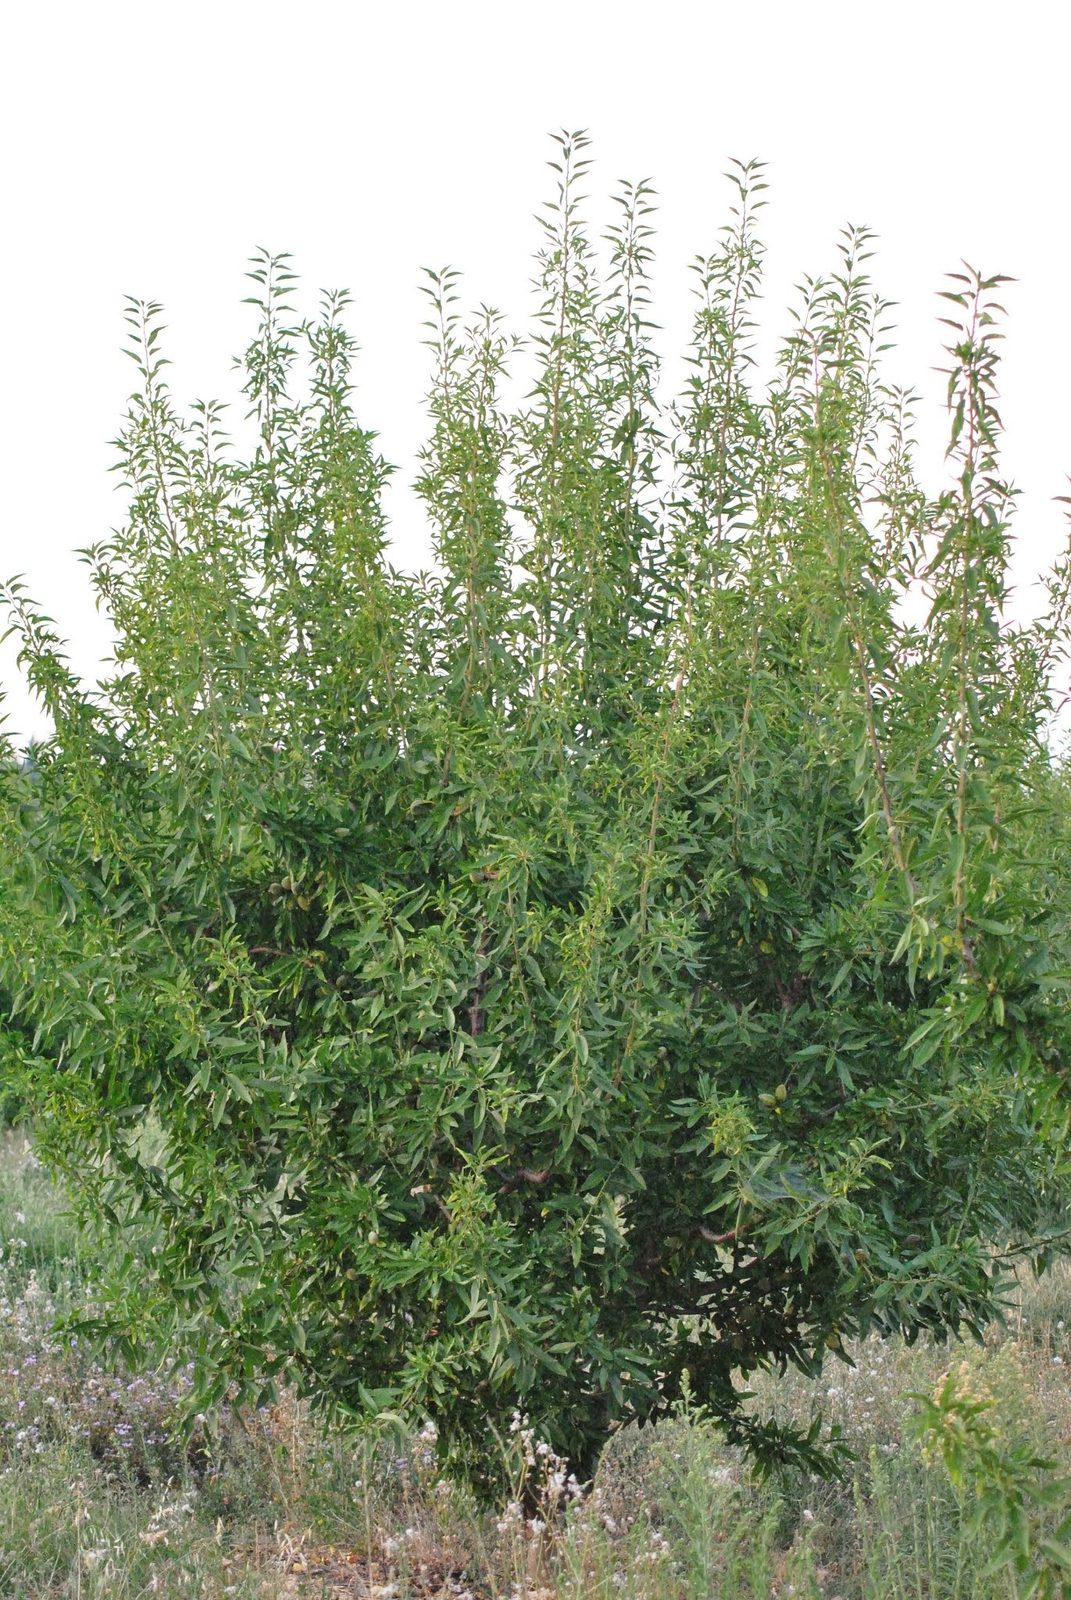
5. Calculating the potassium requirement
The calculation runs in three steps: removal, tree increment, correction from the soil analysis.
Step 1, Removal
K2O removed (kg/ha) = kernel yield (kg/ha) × 0.0912For 2,500 kg of kernel per hectare: 2,500 × 0.0912 = 228 kg K2O.
Step 2, Increment for tree growth
In an orchard still building its canopy, 46 kg K2O per hectare are added [1]. In a fully formed orchard the increment is reduced or omitted.
228 + 46 = 274 kg K2O/haStep 3, Correction from the soil analysis
The soil contributes. The Californian recommendation, based on a five-year potassium rate trial, is clear: on soil with 100 to 150 mg/kg exchangeable potassium, applying 112 kg of K per hectare was enough to meet crop demand, regardless of the form of fertiliser [2]. That corresponds to about 135 kg K2O per hectare, roughly half the removal, with the remainder covered from soil reserves.
| Fertility level | Exchangeable K (ppm, ammonium acetate extraction) | Adjustment to the rate |
|---|---|---|
| Very low | < 75 | Increase by 100% |
| Low | 75 to 150 | Increase by 50% |
| Moderate | 150 to 250 | Replace removal |
| High | 250 to 800 | Reduce to 50% |
| Excessive | > 800 | Omit |
Table adapted from the Californian fertilisation guidelines [5]. A response to potassium fertilisation is considered likely below 150 ppm; in the 150 to 250 ppm range the trees are not expected to respond and replacing removal is sufficient.
Interpreting a soil analysis is not a self-evident procedure, the subject is covered separately in the article How much do soil analyses really help?, in Greek. For converting between element and oxide units there is the Fertiliser Unit Calculator, in Greek.
6. Calculating the phosphorus requirement
The big difference between phosphorus and potassium is not only the ten times smaller quantity. It is that phosphorus deficiency in almond is rare, even on soils that would in theory favour it. In California there are no official phosphorus fertilisation recommendations for almond orchards, precisely because a response is rarely documented [5]. There are not even characteristic symptoms: when phosphorus is short, leaf and shoot growth is restricted without any distinctive picture.
P2O5 removed (kg/ha) = kernel yield (kg/ha) × 0.0184For 2,500 kg of kernel per hectare: 2,500 × 0.0184 = 46 kg P2O5, plus 18 kg for tree growth, that is, 64 kg P2O5 per hectare.
The principle recommended is long-term replacement of removal, not an annual «insurance» dose. When the analysis shows sufficiency, what leaves is replaced; when it shows a shortage, the rate is raised by 50 or 100%; when it shows a high or excessive level, it is halved or omitted [5]. The aim is for soil values to stabilise at the moderate level and stay there.
7. Soil analysis, which test and how it is read
Here a mistake is made that invalidates the whole analysis. The phosphorus extraction method depends on soil pH. In acid to neutral soils (pH below 7) the Bray P1 method is used. In neutral and alkaline soils (pH above 6.5) the appropriate method is Olsen. Using the wrong method simply gives a wrong result [5].
Most soils on which almond orchards are established today in northern and central Greece are calcareous, with pH clearly above 7. The indication is Olsen.
| Level | Bray P1 (ppm PO4-P) for pH < 7 | Olsen (ppm PO4-P) for pH > 6.5 |
|---|---|---|
| Low | < 20 | < 10 |
| Moderate | 20 to 40 | 10 to 20 |
| High | 40 to 100 | 20 to 40 |
| Excessive | > 100 | > 40 |
Where the sample is taken
Almond roots reach a depth of 1.5 to 2 metres, but the majority of the feeder roots are in the top 60 centimetres. Lateral extension reaches 2.5 to 3.5 metres from the trunk, with maximum density within 1.2 to 1.5 metres and within the wetted zone of the irrigation system [5]. The sample is taken from that zone, not from the alley.
Sources: 5
8. Leaf analysis and the critical July values
Soil analysis shows what is in the soil. Leaf analysis shows what reached the tree. The two answer different questions and do not substitute for one another.
The reason sampling is done in July is physiological: nitrogen, phosphorus and zinc concentrations start very high in spring and fall rapidly to mid-June, when they stabilise. Potassium follows a similar course and reaches a plateau at about the same time [5]. That plateau is the only interval in which a measurement can be reliably compared with critical values.
Sampling protocol
- Timing: July, at the concentration plateau.
- Number of trees: 28 to 30 per uniform block, at least 30 metres apart [4] [5].
- Position: leaves from non-fruiting spurs, from the outer canopy, at a height of 1.7 to 2.5 metres.
- Quantity: at least 8 well-exposed spurs per tree.
- Handling: paper bags, kept separate by block, held cool and sent to the laboratory immediately.
A study of 1,148 samples over three consecutive years showed that a sample size of 30 trees achieves a reliable estimate of the block mean [4].
Critical values, July leaves
| Interpretation | Nitrogen (% dry weight) | Phosphorus (%) | Potassium (%) |
|---|---|---|---|
| Deficient | < 2.0 | not reported | < 1.0 |
| Sufficient | 2.2 to 2.5 | 0.1 to 0.3 | > 1.4 |
| Excessive | > 2.7 | not reported | not reported |
Source [5]. The sufficiency range for July potassium is usually given as 1.4 to 2.7% [7].
Prediction from an early sample
The weakness of July sampling is that it comes late, after the period in which most uptake occurs. The solution developed is April sampling: nitrogen and boron concentration in April leaves predicts July nitrogen concentration with a coefficient of determination R² = 0.90 [4]. Correction can then be made within the same growing season, instead of being carried over to the next.
9. The 1% potassium limit, a counter-intuitive finding
The official critical value for July leaf potassium is 1.4%. The potassium rate trial that followed 768 individual trees over five years, with three rates (112, 224 and 336 kg K per hectare) and three potassium sources, gave a result that does not confirm that value [2].
Trees with leaf potassium below 1.4% were considered deficient by the standard criterion, but showed no yield increase when the concentration rose. Above 1% leaf potassium no yield increase was recorded. Potassium rate had no statistically significant effect on yield, and potassium source had an effect in only one of the five years.
The reverse side is equally well documented. Potassium deficiency reduces photosynthesis and carbohydrate transport and accelerates premature leaf senescence and fall. Below 0.5 to 0.6% leaf potassium the rate of carbon dioxide exchange is restricted and carbon fixation falls, with biochemical limitations on photosynthesis [2].
And most critically: a potassium shortage in one year reduces the number of flowers and fruit the next, through increased mortality of the fruiting spurs, without materially affecting fruit set percentage or fruit weight [2] [5]. Very low July potassium values are paid for the following year, not the current one, and that is exactly why the cause is rarely recognised.
10. Which potassium fertiliser, where and when
The first finding is liberating: the potassium in mineral fertilisers is immediately available and the various forms differ very little in effect. Comparisons of potassium sulphate, potassium thiosulphate and potassium chloride showed no differences in yield or in leaf potassium [2] [5]. The choice is made on cost, accompanying elements and chloride risk, not on effectiveness.
| Fertiliser | K2O % | Other elements | Note |
|---|---|---|---|
| Potassium sulphate | 50 | 17 to 18% S | Chloride-free; the safest general choice |
| Potassium thiosulphate | 25 | 17% S | Liquid, for fertigation; frequently and at low rates, high rates cause damage. Acidifies the soil |
| Potassium nitrate | 45 | 13% N | Brings nitrogen too, count it in the nitrogen balance |
| Monopotassium phosphate | 34 | 52% P2O5 | A very high phosphorus ratio; rarely justified as the main potassium source |
| Potassium chloride | 60 to 62 | 46% Cl | The cheapest per unit; requires care because of the chloride |
| Potassium carbonate | 30 | not reported | A liming effect on acid soils |
Analysis figures from the Californian fertilisation guidelines [5]. Actual contents are stated on each product's packaging and should be checked there.
Method and position of application
- Broadcasting over the whole surface is less effective than application in a band or ring along the drip line [5].
- The band is placed about 1.2 metres from the tree row, necessarily within the wetted zone of the irrigation system.
- On heavy, clay soils surface-applied potassium can be held in the top few centimetres and never reach the roots. Alternatively it is incorporated to a depth of 15 to 20 centimetres, in one or two bands either side of the row.
- Under drip irrigation, application through the system is the most practical method and concentrates the potassium exactly where the active roots are.
Timing
| Phase | Days from full bloom | Indicative share of annual K2O | Evidence |
|---|---|---|---|
| Bloom to fruit set | 0 to 45 | 25% | 24 to 40% of the fruit's final potassium has accumulated by 43 days [1] |
| Rapid fruit growth | 45 to 90 | 25% | 45 to 61% by 87 days [1] |
| Shell hardening to kernel filling | 90 to 125 | 20% | 66 to 73% by 111 to 122 days [1] |
| Hull split to harvest | 125 to harvest | 15% | About 30% of the potassium goes in after 101 to 126 days [1] |
| Postharvest to leaf fall | to 249 | 15% | Net potassium accumulation in the perennial organs begins at 98 days and continues to complete leaf fall [3] |
An indicative distribution following the accumulation curve in the fruit and the reserve-loading period. It is not a recommendation to apply; the final distribution is determined by soil type, irrigation system and analysis results.
11. Phosphorus on calcareous soils
Phosphorus availability depends strongly on pH. In acid soils phosphorus is immobilised by iron and aluminium minerals. In alkaline soils, that is, in most Greek soils where almond is planted, the dominant immobilisation mechanism is the formation of insoluble calcium phosphates [5]. Maximum availability lies close to neutral.
In practice, that changes three things:
- Placement becomes critical. Phosphorus does not move with irrigation water or with rain. It does not «travel down» to the root zone from the surface. It is incorporated to a depth of 15 to 20 centimetres, in one or two bands either side of the tree row [5].
- Timing ceases to be critical. Precisely because it does not leach, phosphorus can be applied together with potassium in November, once leaf fall has begun.
- Fertigation with phosphorus carries a technical risk. Phosphorus can be applied with the water, but care is needed over the formation of calcium phosphate, which blocks emitters [5]. In hard water the risk is substantial.
The general behaviour of alkaline soils affects other elements too, iron is the most characteristic example, covered in the article Iron deficiency: causes and management, in Greek, while calcium behaviour is covered in Calcium and its importance for plants.
Sources: 5
12. Hulls and shells back into the orchard
This section carries the greatest economic weight of the whole text. Hulls and shells make up about 70% of the weight leaving the field at harvest [8], and that is where most of the potassium sits. The kernel alone contains about 0.75 to 1% potassium, while the hull exceeds 2% [8].
Trials in three commercial Californian orchards measured what happens when the hull and shell mixture is returned to the soil [8]:
- The mixture contained on average 2.37% potassium at 13% moisture.
- 35 to 70% of the total potassium was released within the first 75 millimetres of water (irrigation and rain together).
- On an annual basis, from autumn application to the following summer, 77 to 95% of the potassium was released.
- Release is driven primarily by water and is not limited by the rate of decomposition, the potassium is not bound in organic compounds that must first break down.
- Exchangeable soil potassium rose significantly at all three sites, with a measurable rise in July leaf potassium as well.
11,210 kg × 0.87 (dry) × 2.37% K = 231 kg K → × 1.2 = 277 kg K2O/haAt a release rate of 85%: about 235 kg K2O per hectare, that is, the entire potassium removal of a 2,500 kg kernel crop.
13. Nitrogen, potassium and hull rot
Nutrition is not only a question of yield. It is also a question of plant protection, in a way that is often not connected up.
In the same nitrogen rate trial, the effect on hull rot (Rhizopus stolonifer, Monilinia spp.) was measured. The result was clear: increasing nitrogen fertilisation increased the incidence of hull rot on the fruiting spurs [9]. Nitrogen fertilisation also delayed the early progress of hull split.
In parallel, a trial of four nitrogen levels in commercial orchards showed that the incidence of blossom and shoot blight, shot hole, scab and hull rot increased as nitrogen fertilisation rose up to a point, above which severity did not increase further [5].
The same trial showed that maximum yield was achieved with July leaf nitrogen in the range 2.4 to 2.5% and that above 2.5% there was no yield increase at all [2]. The window between sufficiency and excess is narrow, about half a percentage point, and the cost of overshooting is not only the wasted fertiliser but also increased disease susceptibility.
One further finding from the same trial deserves attention: raising nitrogen gave lighter fruit, while kernel weight fell with increasing nitrogen under moderate yields and rose under high ones. The overall yield increase came from a greater number of fruit and a higher kernel percentage, not from larger fruit [2].
14. Foliar sprays, what the data show
Foliar application of macronutrients in almond has not been studied extensively, and the available data do not support the expectations that are often cultivated.
A two-year trial with up to three spring foliar applications of different nitrogen, phosphorus and potassium combinations, pre-bloom, at pink bud, 30 days later and 60 days after the first, gave no consistent effects either on kernel yield or on leaf nutrient concentrations [5]. The trees were already well fertilised from the soil.
The conclusion is not that foliar sprays are useless. It is that they do not substitute for soil fertilisation with macronutrients. The quantities a leaf can absorb are orders of magnitude smaller than the annual requirement: when 274 kg of K2O per hectare are needed, a few kilos from a spray do not change the balance. The place of foliar application is in micronutrients and in specific, short-term corrections.
- Spraying over trees carrying fruit can cause marking on the fruit and scorching of the foliage.
- A prior test on a limited number of trees is required, with the same product and the same rate, and a wait of 5 to 7 days before general application.
- Spraying is done in the late afternoon or early morning, never in extreme heat, never on foliage under water stress.
The category of biostimulants, often confused with foliar nutrition, works by an entirely different mechanism and is judged by different criteria, the subject is developed in the article Biostimulants and bioactive substances in agriculture, in Greek.
Sources: 5
15. Water and nutrition, one does not substitute for the other
A nutrient reaches the root with water. Without adequate soil moisture, even fully available potassium stays put. The Spanish studies of rainfed almond orchards note explicitly that the effectiveness of soil-applied potassium depends decisively on soil moisture, which controls the mobility of the elements.
The reverse statement matters just as much: potassium does not make up for water. It supports osmotic regulation and carbohydrate transport, but when water stress limits photosynthesis, no rate of potassium restores assimilate movement.
Competition for water between the leaves and the fruit during shell hardening can cause kernel dehydration, so-called «empty» or shrivelled kernel [10]. At that stage the leaves are fully expanded and act as a sugar source for the following year's buds and for reserve reloading; severe water or nutrient stress here is paid for both this year and the next.
Deficit irrigation is not ruled out. Trials in Spain, on three cultivars of young trees, irrigated at 75% of crop evapotranspiration showed that, combined with biostimulants, yields were maintained, with the greatest improvement in the cultivar Guara (15 to 20% higher kernel yield) and with higher leaf water potential and stomatal conductance at certain stages [11]. The technique is developed for stone fruit in the article Deficit irrigation in peach and nectarine, in Greek, while the atmospheric component of transpiration is covered in VPD: vapour pressure deficit.
Finally, the relationship between light interception and nutrition: in trials in Italian almond orchards yield rose from 1.6 to 4 tonnes per hectare as light interception increased from 35% to 80%, with water use rising in parallel from 6,000 to 13,000 cubic metres per hectare [10]. A greater leaf area demands more water and more nutrients, high-density planting is not neutral with respect to the fertiliser programme.
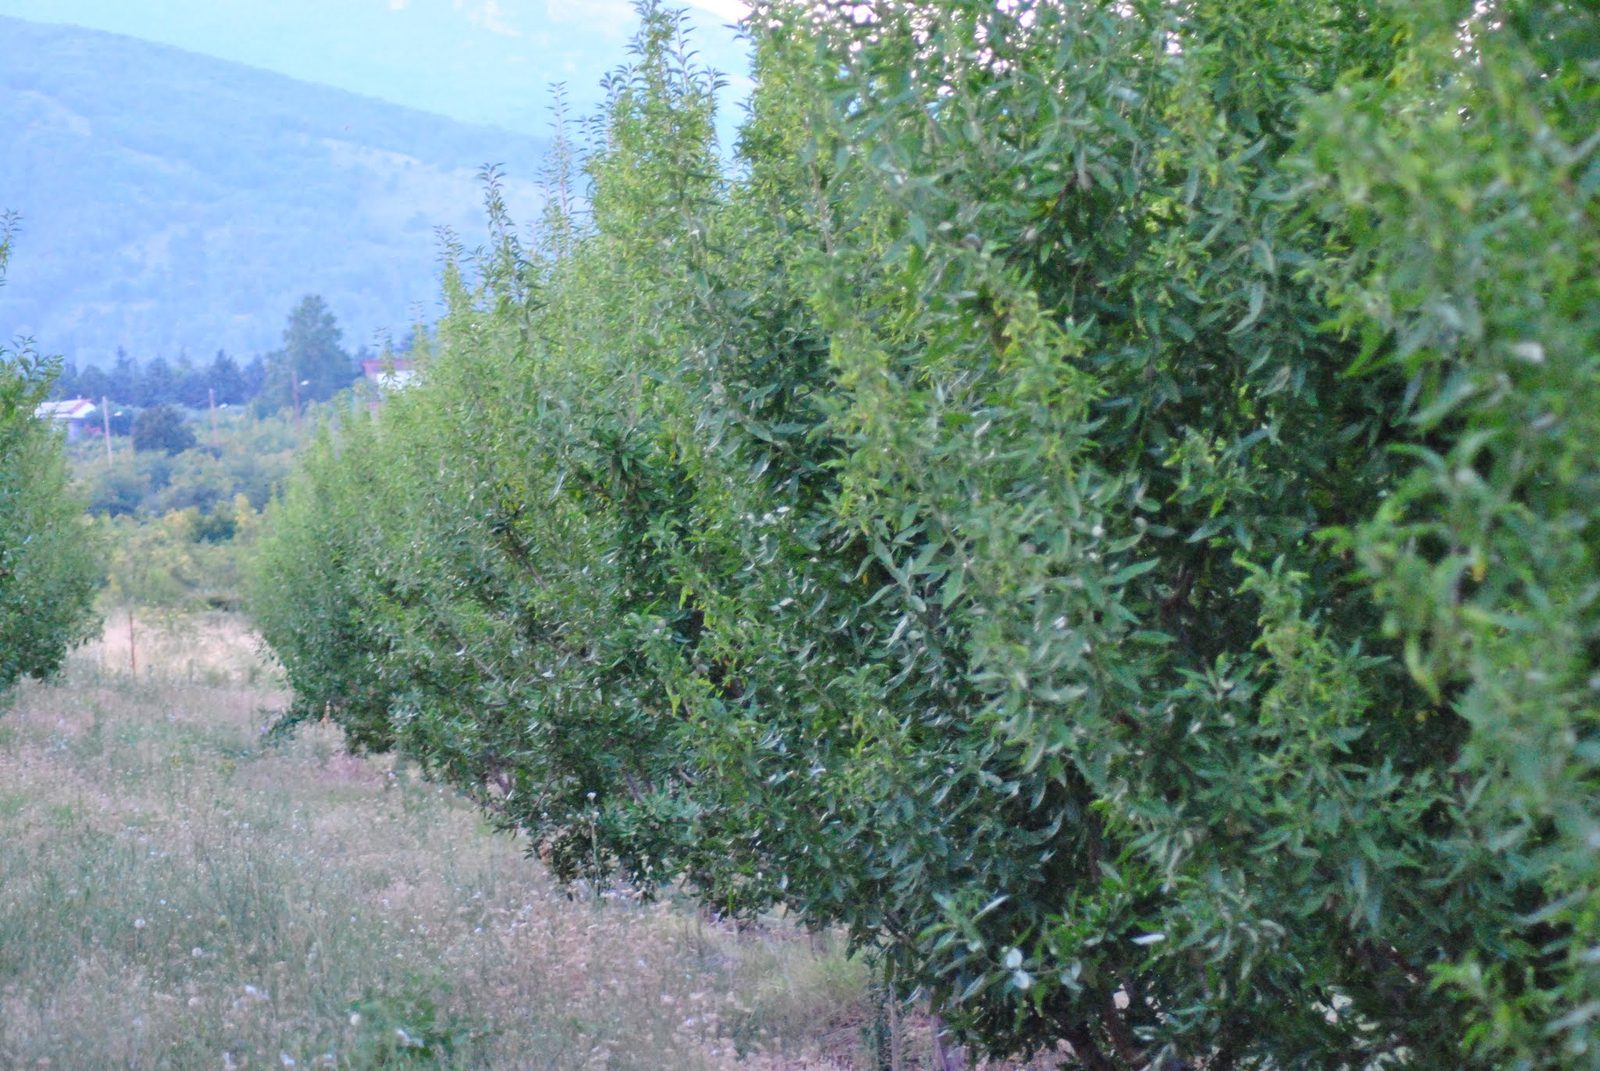
16. An example annual programme
The example concerns a mature, drip-irrigated almond orchard with a mean yield of 2,500 kg of kernel per hectare, on calcareous soil with 180 ppm exchangeable potassium and Olsen P of 15 ppm, that is, moderate sufficiency in both elements.
Step 1, The annual quantities
| Element | Removal | Tree growth | Total | Soil correction | Final target |
|---|---|---|---|---|---|
| Nitrogen (N) | 163 | 44 | 207 | Uptake efficiency 75 to 85% | 240 to 270 kg/ha |
| Phosphorus (P2O5) | 46 | 18 | 64 | Moderate level, replacement | 60 to 70 kg/ha |
| Potassium (K2O) | 228 | 46 | 274 | Moderate level, replacement | 270 to 280 kg/ha |
The nitrogen uptake efficiency of 75 to 85% is reported in the international literature [6]: for 65 kg of nitrogen taken up per tonne of kernel, 76 to 85 kg must be applied.
Step 2, Distribution through the year
| Period | N (kg/ha) | P2O5 (kg/ha) | K2O (kg/ha) | Note |
|---|---|---|---|---|
| September to October, after harvest | 40 | not reported | 40 | The canopy is still active; loading reserves for the following year |
| November, after leaf fall | not reported | 60 to 70 | not reported | Granular, banded, incorporated to 15 to 20 cm; the whole year's phosphorus |
| Bloom to 45 days | 50 | not reported | 70 | Low nitrogen demand, the tree draws on reserves |
| 45 to 90 days | 90 | not reported | 70 | Peak nitrogen uptake |
| 90 to 125 days | 70 | not reported | 55 | Kernel filling |
| 125 days to harvest | not reported | not reported | 45 | Nitrogen stops; potassium continues |
| Total | 250 | 60 to 70 | 280 | not reported |
The values are indicative and are not a recommendation to apply. The final rate and distribution are set after soil and leaf analysis and on-site assessment by an agronomist, on the basis of actual yield, soil type, irrigation water quality and tree age.
Step 3, Checking the result
- April, leaf analysis for nitrogen and boron, to predict the July value and correct within the year [4].
- July, full leaf analysis. Nitrogen between 2.2 and 2.5%, potassium above 1%, phosphorus between 0.1 and 0.3%.
- Autumn, every 2 to 3 years, soil analysis from the wetted zone, using the Olsen method for phosphorus on calcareous soil.
- Every year, recording of actual yield by block. Without it, the removal calculation is guesswork.
17. What fertilisation does not solve
The balance between growth and cropping that every grower is after is not exclusively a nutritional question.
Flower bud differentiation depends on the carbon-to-nitrogen ratio and on the photosynthetic activity of the spur. A spur with a small leaf area will give few flower buds the next year, because carbohydrate replenishment is inadequate [10]. No rate of potassium compensates for shading from bad pruning or premature leaf fall from mites.
Similarly, high performance in the final kernel-filling phase rests to a large extent on stored assimilates and on current photosynthesis. Reloading the storage organs after harvest, while the canopy remains active, determines the starting point of the following year [10].
The key conclusions
- The almond removes 76 kg of potassium and only 8 kg of phosphorus per tonne of kernel, a ratio no commercial compound reproduces [5] [6].
- From bloom to fruit set there is no net uptake of nitrogen from the soil; demand is met entirely from reserves [3].
- 30% of the fruit's potassium goes in after 101 to 126 days from bloom; the potassium programme does not stop when nitrogen does [1].
- Above 1% July leaf potassium no yield increase was recorded on soil with 138 mg/kg exchangeable potassium [2].
- Above 2.5% July leaf nitrogen there is no benefit, while hull rot increases [2] [9].
- On calcareous soil phosphorus is measured by Olsen, placed at depth and in a band, and needs no annual «insurance» dose [5].
- Hulls and shells returned to the root zone can cover almost the whole annual potassium removal [8].
- Foliar macronutrient sprays do not substitute for soil fertilisation [5].
18. Sources
The numbers in the text refer to the list below.
- [1] Muhammad, S., Sanden, B.L., Lampinen, B.D., Saa, S., Siddiqui, M.I., Smart, D.R., Olivos, A., Shackel, K.A., DeJong, T. and Brown, P.H. (2015). Seasonal changes in nutrient content and concentrations in a mature deciduous tree species: Studies in almond (Prunus dulcis (Mill.) D. A. Webb). European Journal of Agronomy 65:52-68. Source for nutrient removal in the fruit (N 212-366, P 26-45, K 265-389 kg/ha), for the annual increment of the perennial organs (44 N, 8 P, 38 K, 3.5 Ca, 2.8 Mg kg/ha) and for the seasonal accumulation curves of nitrogen, phosphorus and potassium in the fruit.
- [2] Muhammad, S., Sanden, B.L., Saa, S., Lampinen, B.D., Smart, D.R., Shackel, K.A., DeJong, T.M. and Brown, P.H. (2018). Optimization of nitrogen and potassium nutrition to improve yield and yield parameters of irrigated almond (Prunus dulcis (Mill.) D. A. Webb). Scientia Horticulturae 228:204-212. Source for removal of 68 kg N and 75 kg K per tonne of kernel, for the finding that above 1% leaf potassium yield does not increase, for the optimum leaf nitrogen of 2.4-2.5% and for the recommendation of 112 kg K/ha on soil with 100-150 mg/kg exchangeable potassium.
- [3] Muhammad, S., Sanden, B.L., Lampinen, B.D., Smart, D.R., Saa, S., Shackel, K.A. and Brown, P.H. (2020). Nutrient Storage in the Perennial Organs of Deciduous Trees and Remobilization in Spring - A Study in Almond (Prunus dulcis) (Mill.) D. A. Webb. Frontiers in Plant Science 11:658. Source for the size of the reserves (N 26.5-44.4, P 6.8-7.2, K 24.4-30.8 kg/ha), for the minimum in the perennial organs at 12-14 days after bloom, for the absence of net nitrogen uptake up to fruit set and for the start of net potassium and phosphorus storage at 98 days.
- [4] Saa, S., Brown, P.H., Muhammad, S., Olivos-Del Rio, A. et al. (2014). Prediction of leaf nitrogen from early season samples and development of field sampling protocols for nitrogen management in Almond (Prunus dulcis (Mill.) D A Webb). Plant and Soil. Source for the sampling protocol of 30 trees at least 30 metres apart, for taking leaves from non-fruiting spurs at a height of 1.7-2.5 m, and for the prediction of July nitrogen from an April sample with R² = 0.90.
- [5] CDFA - FREP / University of California (current edition). California Crop Fertilization Guidelines: Almonds. California Department of Food and Agriculture, Fertilizer Research and Education Program. Source for the critical July leaf values (N 2.2-2.5%, P 0.1-0.3%, K >1.4%), for the Bray P1 and Olsen soil fertility thresholds, for the exchangeable potassium scale, for the analyses and timing of potassium fertilisers, and for the guidance on potassium chloride and on phosphorus fertilisation in alkaline soils.
- [6] Doll, D. Nutrient Removal for Almond. The Almond Doctor. Source for removal of 65 kg N, 8 kg P (18.4 kg P2O5) and 76 kg K (91.2 kg K2O) per tonne of kernel, including hulls, shells, leaves and twigs, and for the nitrogen uptake efficiency of 75-85%.
- [7] Sacramento Valley Orchards / University of California Cooperative Extension. School is Out & Grades are Coming In: Almond July Leaf Analysis. Source for the seasonal course of leaf concentrations and for the potassium sufficiency range of 1.4-2.7% in July leaves.
- [8] Andrews, E. and Kassama, S. (2022). Applying Almond Hulls & Shells as Potassium-Rich Amendments. Sacramento Valley Orchards, University of California Davis. Source for the 2.37% potassium content of the hull-and-shell mixture, for the release of 35-70% of the potassium in the first 75 mm of water and 77-95% on an annual basis, for the 70% share of harvest weight and for the potassium-magnesium antagonism at high rates.
- [9] Saa, S. et al. (2016). Nitrogen increases hull rot and interferes with the hull split phenology in almond (Prunus dulcis). Scientia Horticulturae. Source for the increased incidence of hull rot from Rhizopus stolonifer with rising nitrogen fertilisation and for the delay in the early progress of hull split.
- [10] Losciale, P. (2018). Almond orchard management according to plant eco-physiology. Italus Hortus 25(3):41-50. Source for the uptake of 50% of the nitrogen and 30% of the potassium during shell hardening, for the leaf-fruit competition for water and kernel dehydration, and for the relationship between light interception and yield (1.6 to 4 tonnes/ha as interception rises from 35% to 80%).
- [11] Gutiérrez-Gordillo, S., García-Tejero, I.F., García-Escalera, A., Galindo, P., Arco, M.C. and Durán Zuazo, V.H. (2019). Approach to Yield Response of Young Almond Trees to Deficit Irrigation and Biostimulant Applications. Horticulturae 5(2):38. Source for the maintenance of yield under deficit irrigation at 75% of evapotranspiration and for the 15-20% improvement in kernel yield of the cultivar Guara with biostimulant application.
- [12] Linking Conventional and Organic Rainfed Almond Cultivation to Nut Quality in a Marginal Growing Area (SE Spain) (2023). Agronomy 13(11):2834. Source for the context of rainfed Mediterranean almond orchards, the comparison of yields with irrigated systems and the dependence of soil-applied potassium effectiveness on soil moisture.
- [13] Database of approved plant protection products and biocides, plantprotect.gr, with data from the official database of the Greek Ministry of Rural Development and Food. In Greek. Source for checking approved uses and rates on almond in Greece.
The rates and fertilisation programmes given are indicative and are not a recommendation to apply. They derive from trials on particular soils, cultivars and climatic conditions and do not transfer unchanged to every almond orchard. The final rate is determined after soil and leaf analysis and on-site assessment by a licensed agronomist.
Plant protection products are used solely on the basis of the approvals of the Greek Ministry of Rural Development and Food and of the product label [13]; approvals are valid in Greece only, and elsewhere the corresponding national register applies. Before every application, read the product label.
For every foliar spray: spraying over trees carrying fruit can cause marking on the fruit and scorching of the foliage. A prior test on a limited number of trees is required, with the same product and the same rate, and a wait of 5 to 7 days before general application. Spraying is done in the late afternoon or early morning, never in extreme heat, never on foliage under water stress.
Every intervention is made at the user's own responsibility, following on-site assessment by a licensed agronomist. Pastopoulos Geoponiki L.P. accepts no liability for any damage arising from applying the above.
Related articles
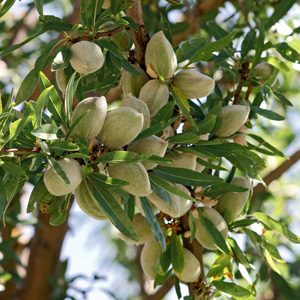
The almond blossom weevil: the pest that works in winter
Anthonomus amygdali destroys flower buds from November to February, with losses that reached 83% in Apulia. The Greek data is very thin. The cycle month by month, recognition in the field, the monitoring methods, and the two windows in which the insect is reachable, the autumn one and the spring one.
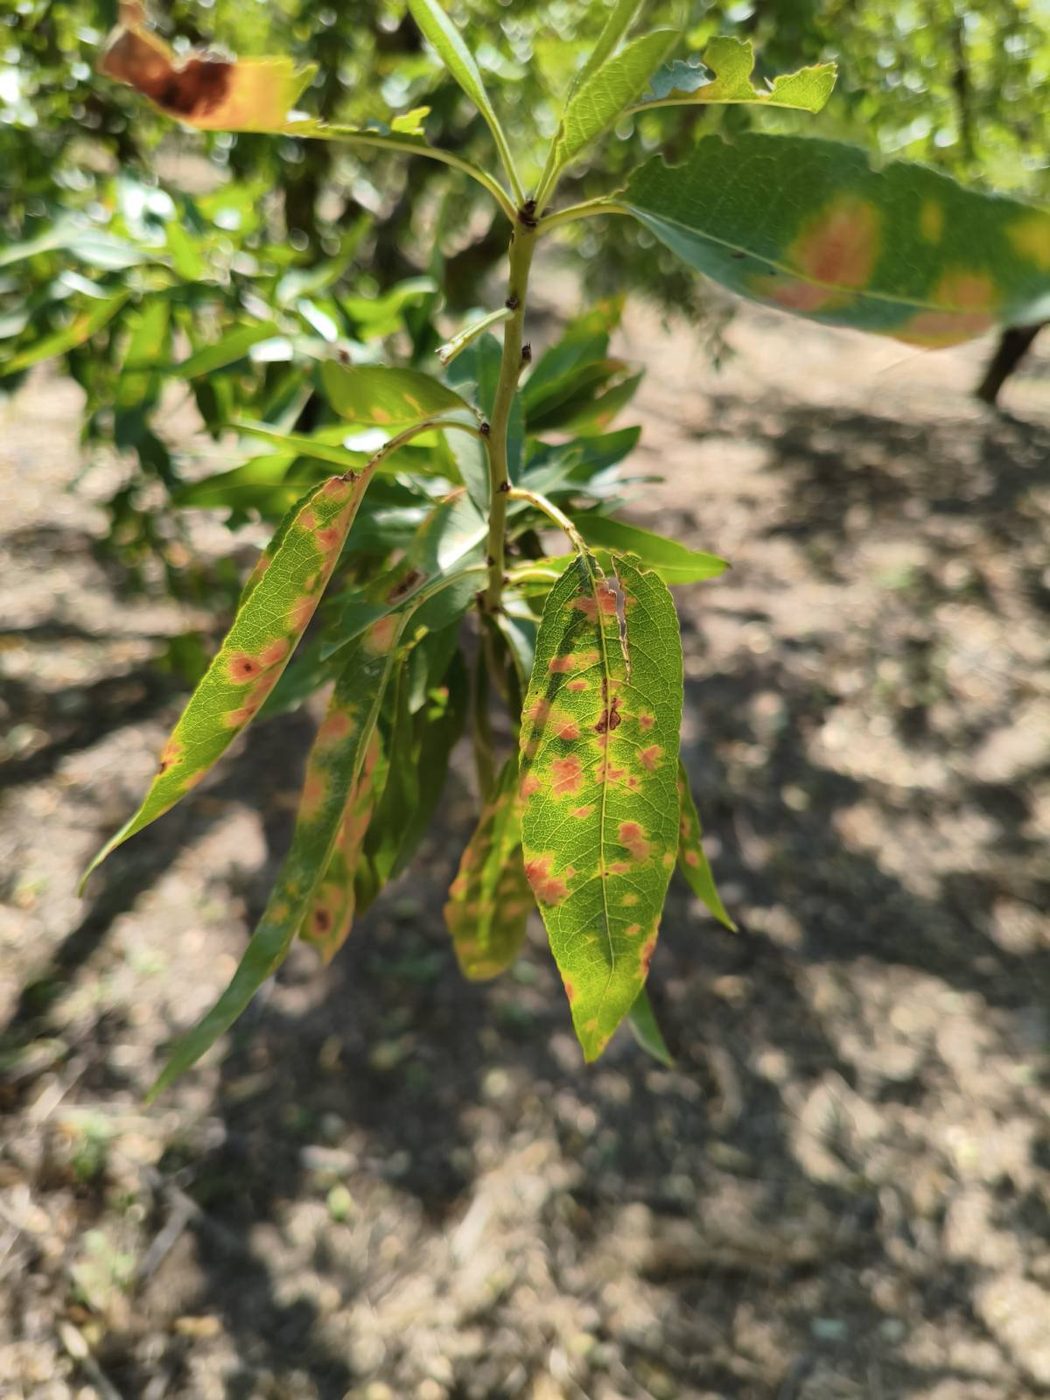
Almond pests and diseases: identification from symptoms, with a diagnostic tool
The almond seed wasp with the phenology of emergence and a 2026 field record from Pella, red leaf blotch as a monocyclic disease with its single spray window, spider mite with the sampling thresholds and abamectin resistance, blossom blight, anthracnose, shot hole, Phytophthora, root rots, bacterial diseases and viruses, and the storage moths with the link between insect damage and aflatoxin. A tool that compares field symptoms against the profiles of 25 causes.
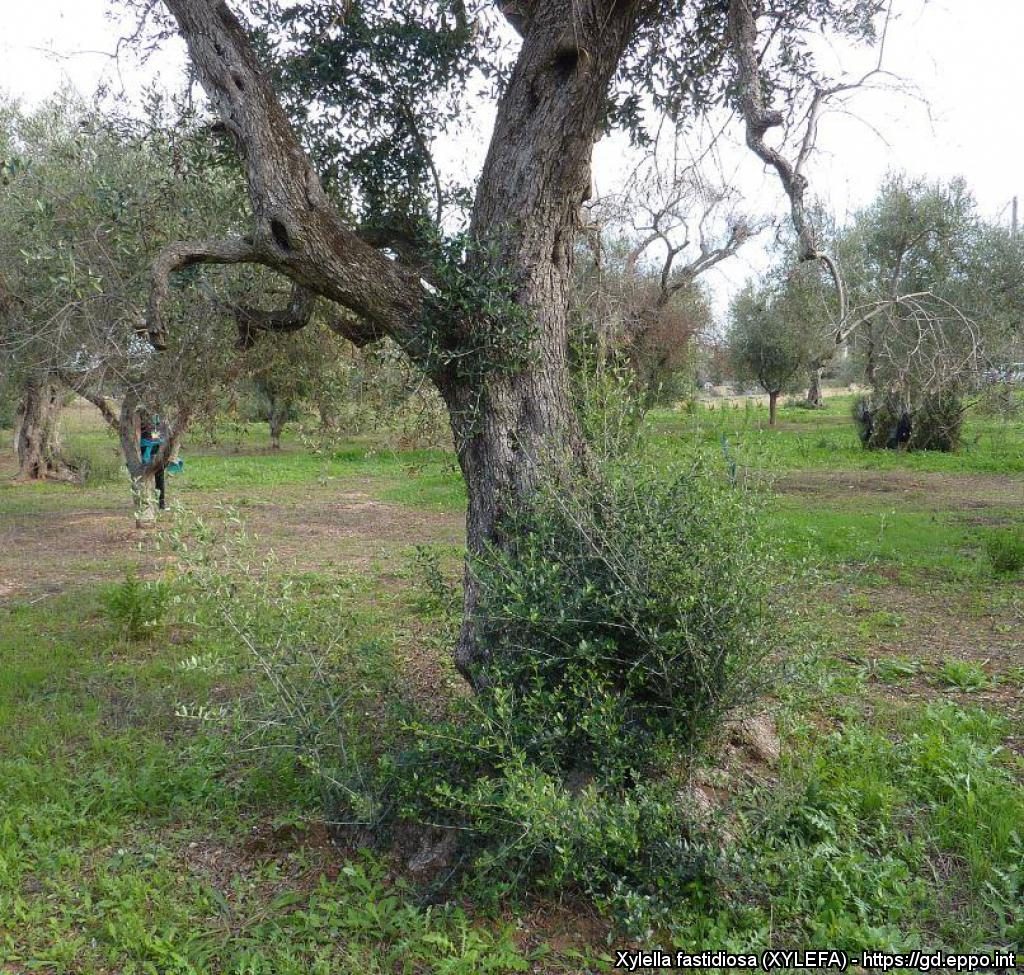
Xylella fastidiosa, a bacterium that threatens tree fruit growing as a whole
The bacterium that destroyed the olive groves of the Salento: how the biofilm kills the tree by thirst, why the nymph of the vector is the only accessible target, why there is no cure, and the two resistant olive cultivars that are now the one hopeful development.