
Kiwifruit physiology: why Brix misleads and dry matter does not
Savvas Pastopoulos, Agronomist MSc, Pastopoulos Agronomics
Every October the same scene repeats itself in the kiwifruit orchards of northern Greece: the refractometer reads 6.2 and the grower decides he can pick. The international literature of the past ten years says something very different, and in fact says that the commonest cause of poor shelf quality is not late but early harvest. This article explains what actually happens inside the fruit from bloom to the cold store, why Brix misleads, and which numbers are worth measuring.
- Maturation and ripening: two words, two different things
- The anatomy of the fruit and why it matters in measurement
- The timetable of growth
- The calcium window closes in July
- Starch: the fruit's bank
- Why Brix rises before harvest, and why cold is not the reason
- Dry matter: the only index that predicts flavour
- Ethylene: climacteric or not?
- The four phases of softening
- The trial that overturns «pick early»
- The contrary evidence, and how the two reconcile
- Water: over-irrigation costs firmness
- Calcium as a tool: Greek data
- Cooling, controlled atmosphere and 1-MCP
- What the law says
- The new non-destructive measurements
- Climate is changing the rules
- A harvest decision protocol
- What to take away
- Sources
1. Maturation and ripening: two words, two different things
Greek uses one word where the international literature uses two, and half the mistakes start from that confusion.
| Term | What it means | Where it happens |
|---|---|---|
| Maturation | The fruit acquires the capacity to ripen properly once picked. It is not edible. | On the vine |
| Ripening | The fruit acquires eating characteristics: it softens, sweetens, develops aroma. | After harvest, in the store or on the shelf |
If the answer is no, no technology corrects it. The fruit will dehydrate, stay sour and astringent, and no ethylene treatment will create sugars that do not exist.
2. The anatomy of the fruit and why it matters in measurement
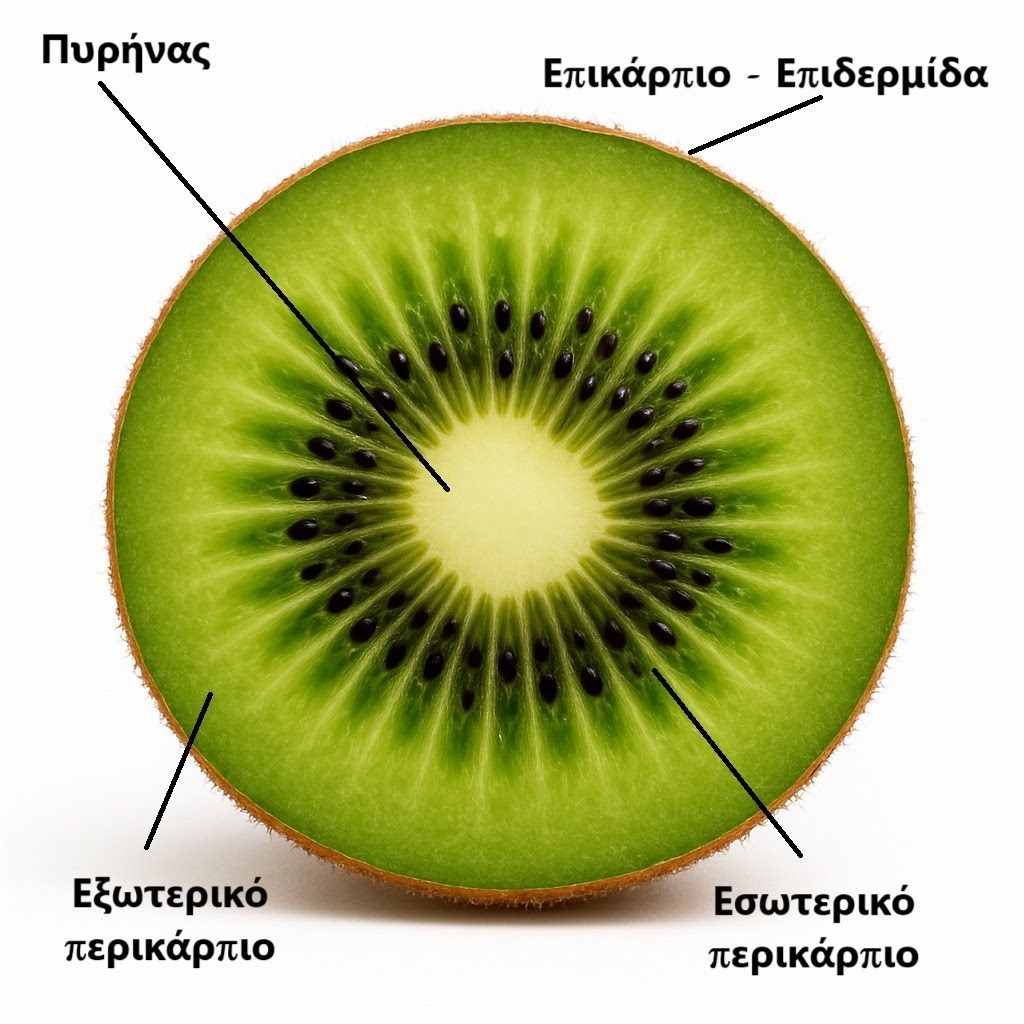
The four tissue zones of the fruit. The distinction has practical significance: firmness is measured in the outer pericarp after the skin has been removed, the inner pericarp is the first to soften, and the core has the highest dry matter of all the zones.
The kiwifruit is a berry derived from a multicarpellate, superior ovary. It consists of four distinct tissue zones:
| Zone | Description | Practical significance |
|---|---|---|
| Exocarp | The skin, only a few cell layers, with hairs in Hayward | Removed before firmness measurement; otherwise the reading is invalid |
| Outer pericarp | Green tissue with chloroplasts | Firmness is measured here with an 8 mm penetrometer tip |
| Inner pericarp | Contains the ring of locules | Softens first; the change in texture starts here |
| Central axis (columella) | White, large parenchyma cells without chlorophyll | Higher dry matter than the other zones |
Around the axis is a ring of locules, elongated slit-shaped chambers running almost the whole length of the fruit and holding the seeds.
Second. The correct botanical name of Hayward is Actinidia chinensis Planch. var. deliciosa (A.Chev.) A.Chev. The authority «C.F. Liang et A.R. Ferguson» belongs to a different name, Actinidia deliciosa (A.Chev.) C.F.Liang & A.R.Ferguson, from when the plant was treated as a separate species. The two attributions are not combined.
3. The timetable of growth
Fruit growth follows a double sigmoid curve. Hopping described three phases:
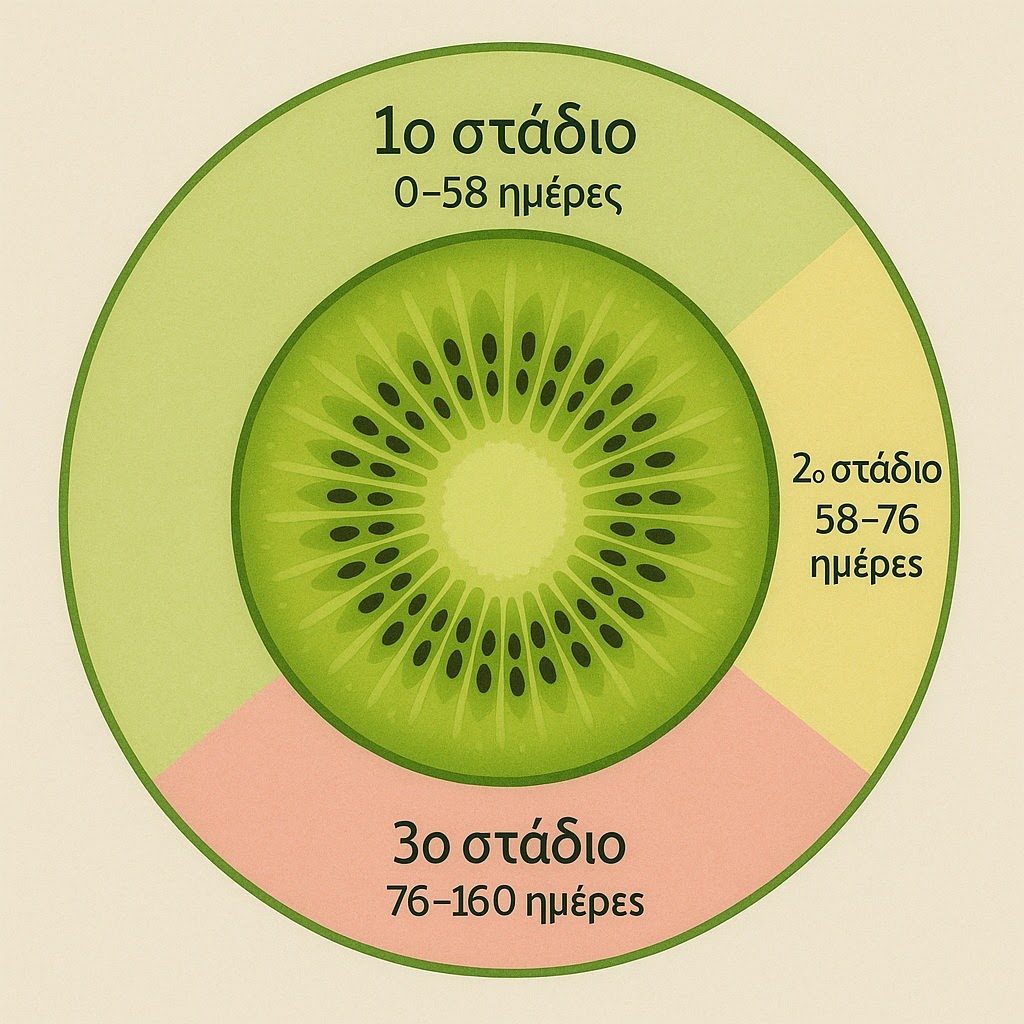
The three growth stages. Note how large a part of the season the first stage occupies: within those first eight weeks the cell number is locked in, and with it the maximum possible capacity of the fruit. In the diagram the boundaries are rounded; strictly, the second stage begins on day 59 and the third on day 77.
| Stage | Days from bloom | What happens |
|---|---|---|
| I | 0 to 58 | Rapid growth with cell division in all tissues and simultaneous expansion |
| II | 59 to 76 | Expansion is confined to the inner pericarp and the axis |
| III | 77 to 160 | Renewed swelling of the same tissues, slow rate, starch accumulation |
Note the boundaries: stage III begins on day 77, not day 76. In many Greek texts 76 appears both as the end of stage II and as the start of stage III, which is plainly impossible.
A later reading simplifies this to two phases: cell division for roughly the first six weeks, then cell expansion with parallel starch storage until harvest.
4. The calcium window closes in July
Calcium travels exclusively in the xylem stream, which is driven by the transpiration of the fruit itself. In kiwifruit, fruit transpiration falls sharply after about 60 days from full bloom, as the pedicel xylem degrades, the skin hairs die and surface conductance falls.
In practice, a September foliar calcium spray does not enrich the fruit by way of the root, it acts, if it acts, locally and superficially.
The whole journey of the ion, from the soil solution to the fruit cell, with the points where it is cut off and the trials that did not show an effect: Calcium and its importance for plants.
The statement that «all the calcium goes in by day 50 from fruit set» is often met. It is nearly right but too absolute on two counts: the milestone is measured from full bloom, not from fruit set, and it is not the whole quantity but the overwhelming majority of the final amount.
5. Starch: the fruit's bank
In most fruits sweetness comes from sugars arriving through the phloem. In kiwifruit something more complex and more interesting applies.
During development, incoming sugars are converted into starch and stored in the plastids of the parenchyma. Starch amounts to about 5 to 7% of fresh weight, that is, 40 to 50% of dry matter at harvest. It is, literally, the fruit's bank account.
Close to maturity, net starch synthesis stops. Later, during ripening, net breakdown begins through α- and β-amylases, and the products, glucose, fructose, sucrose, give the sweetness of the eating-ripe fruit.
6. Why Brix rises before harvest, and why cold is not the reason
Here lies the most important conceptual correction of recent years, and it has direct consequences for Greece.
The old explanation
The 6.2 °Brix threshold was established in New Zealand in the early 1980s and adopted by almost every producing country. The rationale was that in New Zealand cool autumn weather triggered early starch breakdown, so Brix rose before harvest and served as an indicator of maturity.
The newer reading
The real starch breakdown, which gives the big jump in sweetness, happens later, as part of ripening, and follows a sigmoid curve under genetic control, unless exposure to cold or ethylene intervenes once the fruit has become responsive.
The distinction explains why the 6.2 °Brix threshold was transferred uncritically. In most Mediterranean regions the autumn is distinctly warmer than in New Zealand, so the original assumption simply does not hold. And confirmation came from the findings themselves: the rise in Brix proceeds almost linearly in the field, by about 3.6 units from 136 to 198 days after full bloom, with no need for a cold stimulus [1].
Sources: 1
7. Dry matter: the only index that predicts flavour
If harvest Brix does not tell how sweet the fruit will become, what does?
Dry matter. It includes both the soluble fraction (sugars) and the insoluble one (chiefly starch and structural carbohydrates). Because almost all the starch will eventually be converted into sugars, harvest dry matter predicts the final Brix of the eating-ripe fruit.
Non-soluble dry matter
Even more diagnostic is the NSDM index, the percentage of dry matter that is not soluble:
NSDM (%) = (Dry matter − SSC) × 100 / Dry matter
How the two numbers are measured
The formula is of no use without knowing how dry matter and soluble solids are obtained. The protocol follows, as applied in the published work [1].
- Cut a slice from the «equator» of the fruit, that is, from its widest point, 2 mm thick. One slice per fruit.
- Weigh immediately the fresh slice on a two-decimal balance (0.01 g). Record the fresh weight.
- Dry at 65 °C in an oven or food dehydrator, to constant weight, typically about 24 hours.
- Weigh again. «Constant weight» means that two successive weighings two hours apart give essentially the same value. If the weight is still falling, it is not finished.
Dry matter (%) = Dry weight × 100 / Fresh weight
- Extract juice from the same fruit. Hard fruit needs a juicer; soft fruit can be squeezed by hand.
- Measure with a digital refractometer. The result is expressed in °Brix, that is, as a percentage.
- Clean the prism between samples and check the zero with distilled water.
NSDM = (17.5 − 7.0) × 100 / 17.5 = 60.0% → comfortably above the 40% threshold
A second example, a fruit with dry matter 15% and soluble solids 9.5%:
NSDM = (15 − 9.5) × 100 / 15 = 36.7% → below 40%
The second fruit has higher Brix and would have persuaded anyone to pick. But it has low dry matter and has already burned much of its starch: it has no reserve left to sweeten further in storage. That is exactly what a refractometer on its own does not show.
Titratable acidity. Dilute the juice 1:20 with water and titrate with 0.1 M NaOH to pH 8.1. The result is expressed as citric acid, g per 100 g of fresh weight. This one needs a laboratory, if it is not available, rely on the first three.
Sample: at least 30 uniform fruit per replicate. Measurements are made after the fruit has equilibrated to room temperature, not straight from the fridge.
In the field, NSDM starts to fall at around 160 days from full bloom and drops steadily, from about 66% to below 50% by late November. It is the mirror image of soluble solids, and shows clearly that starch has stopped accumulating [1].
- Dry matter (DM) > 17%
- Soluble solids (SSC) > 7%
- Titratable acidity (TA) 2.0 to 2.6%
- Over 40% of the dry matter non-soluble (NSDM > 40%)
Sources: 1
8. Ethylene: climacteric or not?
Kiwifruit is traditionally classed as a climacteric fruit. The reality is more complex and worth knowing, because it explains the behaviour of the store.
The data that create the problem
- Most of ripening happens without ethylene. The fruit softens, starch breaks down and sugars rise while ethylene production remains undetectable.
- Autocatalytic ethylene production appears at the end, when the fruit is already very soft, typically at around 1 kgf or less. That is, ethylene does not start ripening; it completes it.
- The fruit can soften from exposure to low temperature alone, with no ethylene involved.
The practical conclusion
Whatever the classification, one thing is certain: kiwifruit is extremely sensitive to exogenous ethylene. Minute concentrations are enough to raise respiration and collapse firmness. Therefore:
- No damaged or infected fruit goes into the store.
- Fruit from vines with esca, from plants under water stress or from affected blocks ripens prematurely and drags the healthy fruit with it.
- It is not stored together with ethylene-producing fruit.
In trials on Hayward, fruit treated with propylene at 20 °C immediately after harvest produced ethylene with a lag of three days and ripened in 3 to 5 days, while the controls did not ripen at all within the nine days of the study [2].
Sources: 2
9. The four phases of softening
Softening is not one continuous process but four distinct stages. The three-phase description that circulates is incomplete: it leaves out the over-ripening phase.
| Phase | What happens | Ethylene |
|---|---|---|
| 1 | Slow softening. The fruit is still inedible | Absent |
| 2 | Rapid softening. Ripening effectively starts here; accelerated by cold or ethylene | Production begins |
| 3 | Pectin solubilisation, the fruit reaches «eating ripe» | Autocatalytic production |
| 4 | Over-ripening, collapse of texture | Peak and then decline |
Four phases under the current description [1]. The transition from phase 1 to phase 2 is the real starting point of ripening.
Fruit is considered eating-ripe when firmness falls below 25 N [1]. For comparison: at harvest firmness is typically 56 to 65 N, and after six months in controlled atmosphere it falls to 11 to 16 N [1].
Sources: 1
10. The trial that overturns «pick early»
This section deserves attention, because its conclusion is the opposite of what most growers do.
In a commercial 15-year-old Hayward orchard, ripening was monitored weekly from 136 days after full bloom. Fruit was harvested at three times, 152, 178 and 192 DAFB, and stored at −0.5 °C for 3 to 6 months in normal atmosphere or 6 to 10 months in controlled atmosphere, with or without 1-MCP [1].
The fruit of the first harvest (152 DAFB), which was the firmest on the day it was picked, came out the softest at the end of storage, in both storage systems.
Delaying harvest also slowed the fall in acidity, so the late-picked fruit retained the highest acidity on removal from store. Overall quality after shelf life improved with delaying harvest to late November, about 200 DAFB.
The researchers summarise the commercial rule as «Last In, Last Out» (LILO): what goes into the store last comes out last [1].
But the conclusion is the reverse of the paper's own. The acceleration of softening on the vine is not a reason to pick earlier; it is a sign that the fruit is entering the phase in which it ripens properly. The late-picked fruit, though softer at harvest, lasts longer in storage.
Sources: 1
11. The contrary evidence, and how the two reconcile
It would be dishonest to present only one side. There is also research showing that very late harvest is damaging too.
In a trial on the Black Sea coast, Hayward fruit was harvested at four soluble solids levels and stored at 0 ± 1 °C at 85 to 90% relative humidity for six months [3]:
| Harvest | SSC at harvest | Result after 180 days |
|---|---|---|
| H1 (very early) | 5.0 to 6.0% | Faster loss of firmness, large fall in acidity and SSC, higher weight loss |
| H2 | 6.1 to 7.0% | Optimum, best retention of quality, highest proportion of marketable fruit |
| H3 | 7.1 to 8.0% | Optimum, together with H2 |
| H4 (late) | 8.1 to 9.0% | Faster loss of firmness and weight, as in the early harvest |
In the same work, the beneficial constituents increased continuously the later the harvest, ascorbic acid, total phenolics, antioxidant capacity [3]. That is, nutritional value and storage life do not peak at the same point.
The shared conclusion, and the useful one, is threefold: very early harvest is punished hard; quality is judged not by Brix but by dry matter and acidity; and every orchard needs its own curve, not a number borrowed from another continent.
12. Water: over-irrigation costs firmness
This section is, in my view, the most underrated in Greek practice.
In a trial with four irrigation levels, 100%, 68%, 57% and 40% of evapotranspiration (ETc), on Actinidia chinensis var. chinensis, with sap flow sensors and fruit diameter gauges, the results were striking [4]:
| Treatment | Diameter (mm) | Firmness (kgf cm⁻²) | Dry matter (%) | Acidity (g L⁻¹) |
|---|---|---|---|---|
| 100% ETc (full) | 47.69 b | 4.74 b | 18.32 c | 11.81 b |
| 68% ETc | 48.66 a | 5.44 a | 18.55 bc | 14.42 a |
| 57% ETc | 45.40 c | 5.60 a | 19.97 a | 14.92 a |
| 40% ETc | 43.06 d | 5.56 a | 19.28 ab | 14.70 a |
Different letters indicate a statistically significant difference [4].
And full irrigation came last in dry matter, that is, in the index which, as section 7 showed, predicts the flavour of the final product.
The authors' conclusion is clear: optimising irrigation, avoiding over-irrigation, can give higher dry matter without reducing fruit diameter.
The VPD threshold
The same work identified something connected directly to canopy and microclimate management: there is a vapour pressure deficit (VPD) threshold at about 1.8 to 2.0 kPa, above which the stomata begin to close regardless of water availability [4].
Below 2 kPa, well-irrigated vines keep their stomata open. Above it, watering does not help, the plant closes down.
The picture is not universal: recent work in southern Italy found no restriction of stomatal conductance even at VPD up to 4 kPa, possibly because of different vine adaptation [4].
The daily dynamics are also interesting: sap flow continues to rise after the stomata have begun to close, which indicates refilling of the storage tissues, and the fruit refills at night, when competition for water is lower [4].
Sources: 4
13. Calcium as a tool: Greek data
Since calcium no longer enters the fruit after July, the question is whether foliar applications make sense. There is a two-year Greek trial on Hayward that gives an answer [5].
| Parameter | Result |
|---|---|
| Flesh firmness | Increased in all treatments with organic calcium |
| Dry matter | Increased in all treatments |
| Soluble solids and acidity | Increased |
| Leaf nutrients | Higher N, P, K and B than the control |
| Fruit nutrients | N, B, K and Ca increased; Mg decreased |
| Mn, Zn, Fe, Cu | Unaffected in both leaves and fruit |
The optimum rate of that particular product was determined at 2 to 4 kg per tonne/hectare, and the authors link the higher calcium concentration with better postharvest retention [5].
Second. This was a complete nutrition programme with particular commercial products, not a stand-alone calcium spray. The result does not transfer automatically to any calcium product.
Sources: 5
14. Cooling, controlled atmosphere and 1-MCP
The store does not improve the fruit. It can only slow the loss.
Temperature
Stability matters more than the absolute value. Small fluctuations around 0 °C disturb the softening pattern. An important and counter-intuitive finding: fruit softened faster at 4 and 8 °C than at 16 °C during the first three weeks of storage, probably because at those temperatures the fruit is more sensitive to ethylene.
The statement «from 4 to 12 °C the softening rate stays constant, while at 5 °C the fruit softens faster» is sometimes met. The two sentences cancel each other out: if the rate is constant over 4 to 12 °C, 5 °C cannot stand out.
Controlled atmosphere
In trials on Hayward at 0 °C for 60, 120 and 180 days, three systems were compared [2]:
| System | Composition | Behaviour |
|---|---|---|
| Normal air | 21% O₂ | Faster softening in the first 60 days |
| Controlled atmosphere (CA) | 2% O₂ + 5% CO₂ | Clearly reduced softening rate; the fruit ripened normally on the shelf |
| Ultra-low oxygen (ULO) | 0.7% O₂ + 0.7% CO₂ or 1% + 1% | Even less softening, but the fruit did not ripen fully without intervention |
Soluble solids increased sharply in the first 60 days and then stayed almost constant in all treatments [2].
1-MCP, an inhibitor of ethylene receptors, reduces the softening rate and extends storage life, particularly combined with CA [1].
15. What the law says
The marketing standard for kiwifruit is set out in Commission Implementing Regulation (EU) No 543/2011. The maturity requirements are [6]:
- at least 6.2 °Brix, or
- an average dry matter content of 15%,
Two observations for the grower:
- 6.2 °Brix is a legal minimum, not a quality target. The law sets the floor below which the product may not be marketed; it does not guarantee good fruit.
- The Regulation's 15% dry matter is far from the >17% the research proposes for fruit that will spend months in storage [1]. For long storage and export, the legislation is not enough.
16. The new non-destructive measurements
The basic problem with the classical measurements is that they destroy the fruit: a sample of a few dozen fruit is measured and generalised to tens of tonnes.
Hyperspectral imaging allows dry matter to be predicted before harvest, without cutting the fruit. In recent work, using nine characteristic wavelength bands from 538.93 to 856.80 nm and partial least squares regression, R² = 0.92 with an error of 0.41% was achieved on the training set and R² = 0.85 with an error of 0.50% on the test set [7].
Sources: 7
17. Climate is changing the rules
Kiwifruit is among the crops under most pressure from climate change, and the mechanisms bear directly on fruit physiology [8].
| Pressure | Mechanism | Consequence for the fruit |
|---|---|---|
| Insufficient winter chill | Incomplete breaking of dormancy | Irregular, prolonged bloom; uneven maturity |
| Spring frosts | Earlier bud break combined with frosts | Destruction of flowers and young fruit |
| High temperatures | Respiration is inhibited above 44.5 °C | Reserve accumulation stops; sunburn |
| Summer drought | Stomatal closure above the VPD threshold | Smaller fruit, lower dry matter |
| Pathogen pressure | More favourable conditions for Psa | Stressed vines, premature ripening, ethylene in the store |
Among the adaptation measures recorded are shade netting, to reduce sunburn and create a favourable microclimate, and covering systems, which also reduce VPD late in the season [4][8].
18. A harvest decision protocol
What to measure and when
- Start at 130 to 140 days from full bloom. Keep a record of full bloom for each block, without it there is no DAFB.
- Sample every week. At least 30 uniform fruit, from the same vines, from all canopy exposures.
- Measure four things: dry matter, soluble solids, titratable acidity and firmness (8 mm penetrometer, after removing the skin).
- Calculate NSDM at every sampling. The moment it starts to fall is the signal that starch has stopped accumulating.
- Do not pick before DM > 17% and SSC > 7%, with NSDM above 40% and acidity in the 2.0 to 2.6% range.
- If the fruit is destined for long storage, delay. The «Last In, Last Out» rule has experimental support.
Frost. In northern Greece the risk of an early autumn frost is real and can wipe out the crop. A delayed-harvest strategy presupposes close attention to the forecast. One frost cancels every theoretical quality gain.
19. What to take away
The ten points
- Maturation ≠ ripening. On the vine the fruit acquires only the capacity to ripen.
- Cell number is locked in during the first six weeks. Spring stress cannot be made up.
- Calcium stops entering at around 60 days from full bloom, along with fruit transpiration, the calcium pathway in detail here.
- Starch is 40 to 50% of dry matter at harvest and is the only reserve of sweetness.
- The first rise in Brix is not starch breakdown, but a halt in the conversion of sugars into starch.
- Dry matter predicts flavour, harvest Brix does not. Threshold: DM > 17%.
- Early harvest is punished. The firmest fruit at harvest came out the softest after storage [1].
- Over-irrigation costs. In yellow-fleshed kiwifruit, 68% of ETc gave larger, firmer and more acid fruit than full irrigation [4].
- Above 1.8 to 2 kPa VPD the stomata close regardless of watering [4].
- Ethylene does not start ripening, it completes it, but one damaged fruit is enough to drag a whole store with it.
The quality of Greek kiwifruit is not decided on the day of harvest. It is decided in spring, when cell number is set; in summer, when how much water to give and how much dry matter will accumulate are settled; and by the discipline of autumn, when the temptation to pick early because the refractometer read 6.2 has to be resisted.
20. Sources
The numbers in the text refer to the list below.
- [1] Goldberg, T., Agra, H. and Ben-Arie, R. (2021). Quality of ‘Hayward’ kiwifruit in prolonged cold storage as affected by the stage of maturity at harvest. Horticulturae 7(10):358. Source for the linear increase of ~3.6 SSC units from 136 to 198 DAFB, for the fall in NSDM from ~66% to <50%, for the softening rates of 0.1 and 0.5 N per day with an inflection at 175 DAFB, for the criteria DM>17%, SSC>7%, TA 2.0-2.6% and NSDM>40%, for the finding that the 152 DAFB fruit came out the softest, for the LILO rule and the improvement from delaying to ~200 DAFB, for the four softening phases, for the eating-ripe limit below 25 N and for the values of 56-65 N at harvest and 11-16 N after six months in controlled atmosphere.
- [2] Antunes, M.D.C. and Sfakiotakis, E.M. (2002). Ethylene biosynthesis and ripening behaviour of ‘Hayward’ kiwifruit subjected to some controlled atmospheres. Postharvest Biology and Technology 26(2):167-179. Source for the comparison of normal air, controlled atmosphere at 2% O₂ + 5% CO₂ and ultra-low oxygen at 0 °C for 60, 120 and 180 days, for the three-day lag and ripening in 3-5 days after propylene, for the faster softening in normal air during the first 60 days, and for the inability of fruit from ultra-low oxygen to ripen fully.
- [3] Bakoğlu, N. and Tuna Güneş, N. (2024). Impact of harvest time on cold storage performance in kiwifruit. Journal of Food Composition and Analysis. Source for the four harvest dates at SSC of 5-6%, 6.1-7.0%, 7.1-8.0% and 8.1-9.0%, for the six-month storage at 0±1 °C at 85-90% relative humidity, for the finding that both early and late harvest gave faster loss of firmness and weight, for the optimum window of 6.1-8.0%, and for the continuous increase in ascorbic acid, phenolics and antioxidant capacity with delayed harvest.
- [4] Fernandes, R.D.M. et al. (2025). Kiwifruit ecophysiological adaptations under moderate and severe deficit irrigation. Scientia Horticulturae 347:114193. Source for the four irrigation treatments at 100%, 68%, 57% and 40% of ETc, for the quality table with the greatest diameter, firmness and acidity at 68% ETc, for the lowest dry matter under full irrigation, for the VPD threshold of 1.8-2.0 kPa above which the stomata close, for the absence of restriction up to 4 kPa in other work in southern Italy, and for the night-time refilling of the fruit.
- [5] Sotiropoulos, T. et al. (2023). Effect of preharvest foliar calcium sprays on quality properties and nutritional status of kiwi cv. ‘Hayward’. Notulae Botanicae Horti Agrobotanici Cluj-Napoca 51(2):13109. Source for the increase in flesh firmness, dry matter, soluble solids and acidity with organic calcium, for the increase in leaf N, P, K and B, for the increase in fruit N, B, K and Ca and the decrease in Mg, for the absence of effect on Mn, Zn, Fe and Cu, and for the optimum rate.
- [6] Commission Implementing Regulation (EU) No 543/2011, Annex I, specific marketing standard for kiwifruit. EUR-Lex. Source for the minimum maturity requirement at packing: 6.2 °Brix or an average dry matter of 15%, so as to yield 9.5 °Brix on entering the distribution chain.
- [7] Yang, H. et al. (2024). Determination of dry-matter content of kiwifruit before harvest based on hyperspectral imaging. AgriEngineering 6(1):52-63. Source for the prediction of pre-harvest dry matter using nine characteristic bands from 538.93 to 856.80 nm and partial least squares regression, with R²=0.92 and an error of 0.41% on the training set and R²=0.85 with an error of 0.50% on the test set.
- [8] Rajan, P. et al. (2024). Climate change impacts on and response strategies for kiwifruit production: a comprehensive review. Plants 13(17):2354. Source for the risk of insufficient winter chill, for spring frosts, for the inhibition of respiration above 44.5 °C, for increased pressure from Psa, and for adaptation measures such as shade netting and covering systems.
This article is general technical information and not individual agronomic advice. The thresholds and values cited come from published experimental work in particular regions, cultivars and conditions and do not transfer automatically to every orchard. Every block needs its own measurements.
The harvest start date is set by the authorities in Greece and overrides any technical assessment. Fertilisers, biostimulants and postharvest products are used solely according to the label and the approvals in force; the label always prevails.
A nutrition, irrigation and harvest programme is set after analyses and on-site assessment by a licensed agronomist, and responsibility for application rests solely with the user. Pastopoulos Geoponiki L.P. accepts no liability for any damage arising from use of this information.
Related articles
Copper nanoparticles for kiwifruit bacterial canker
A Chinese study compared three copper nanomaterials with a conventional bactericide. On the plate they needed concentrations at least sixty four times lower. On the plant the control efficacies fell into the same range…
Training kiwifruit: T-bar and pergola
The architecture of the kiwifruit vine and why both training systems follow from it. T-bar and pergola with their dimensions, advantages, costs and a comparison in numbers. Training from the day of planting: planting high, a first season for the root with tipping at one metre, cutting back low the following spring and taking the trunk up in the second season, leaders, winter and summer pruning, males and the support structure. Three diagrams, a table of mistakes, and the gaps that remain for Greece. A field observation from Giannitsa on planting distances.
Chilling hours: the three models and when each one tells the truth
Chilling Hours, Utah Chill Units or Dynamic Chill Portions, what each measures, which suits which climate and season, why a chill portion does not convert into hours, and how the divergence between the three is read. The calculation itself lives in a separate tool.