
Chilling hours: the three models and when each one tells the truth
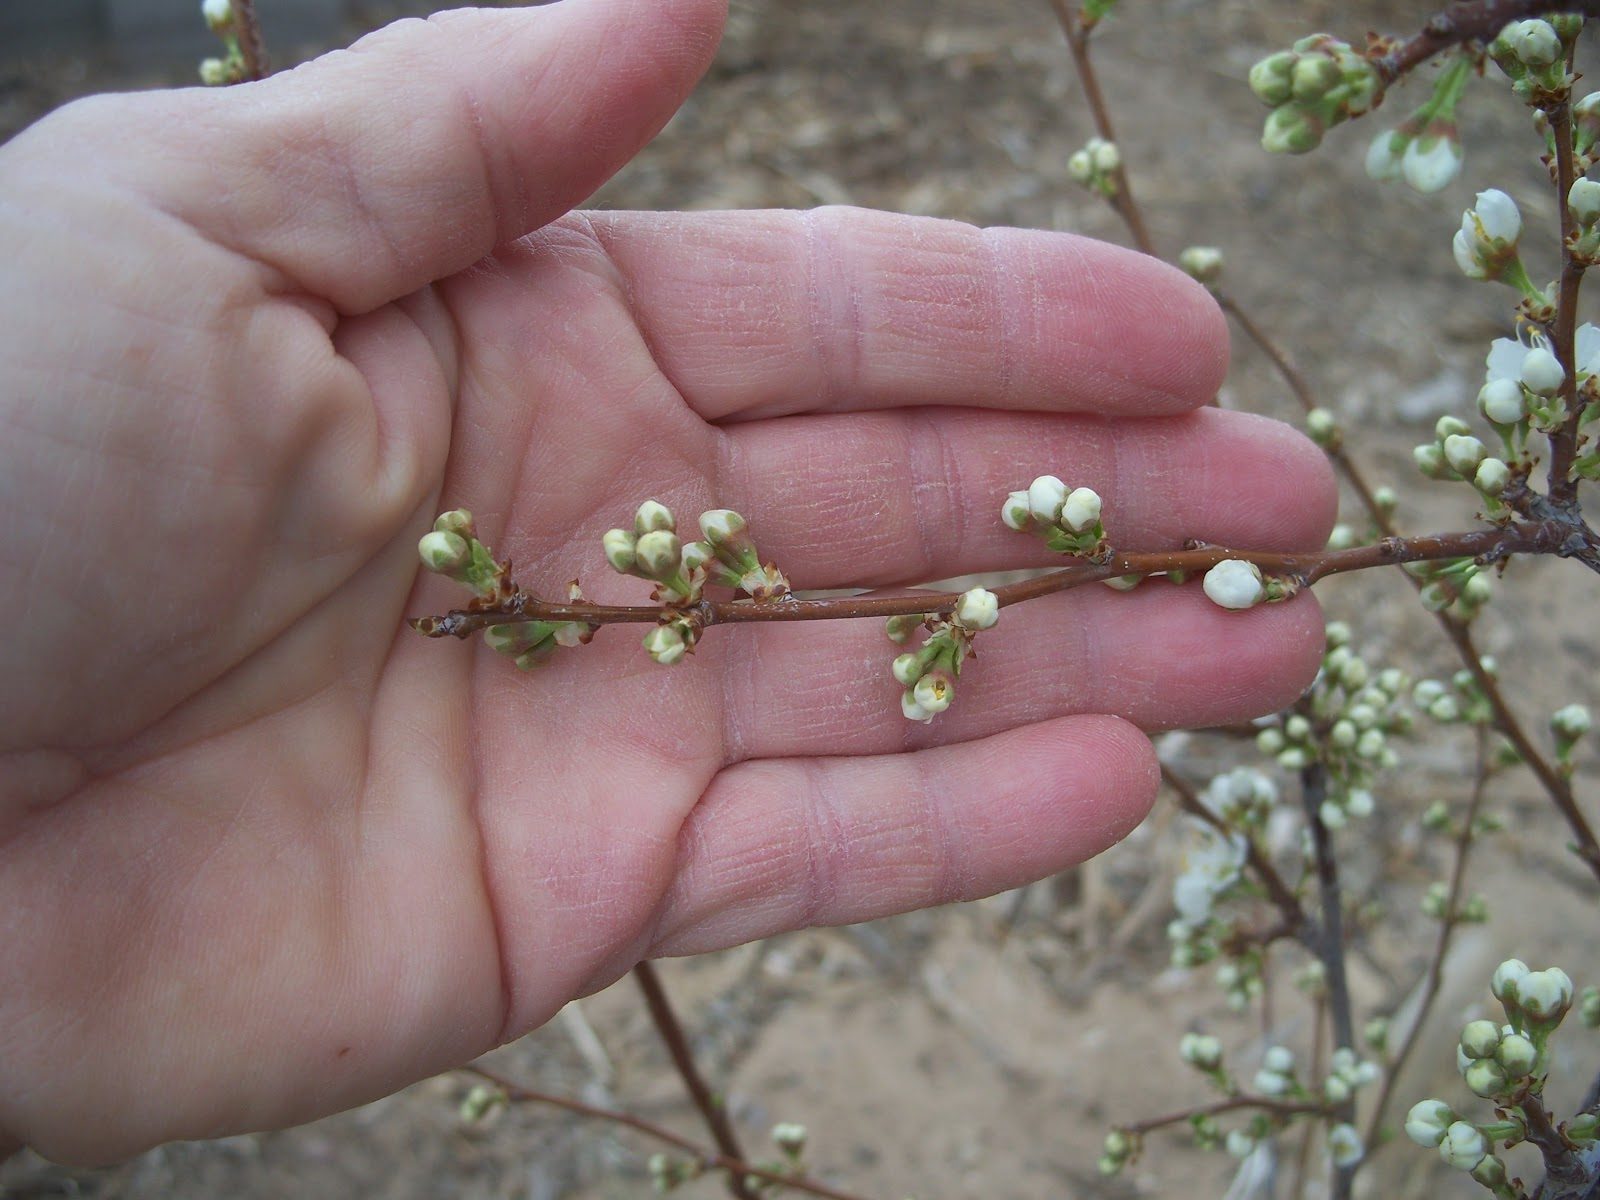
Savvas Pastopoulos, Agronomist MSc, Pastopoulos Agronomics, Neos Mylotopos, Pella, Greece
“Chilling hours” is not one quantity. It is at least three, with different units, different logic and different reliability depending on the climate and the season. This article explains what each of them measures, which one suits which conditions, and points to the tool that runs all three models on the same data, with no installation and without the data leaving the machine.
- Why a model is needed and a thermometer is not enough
- The three models, with their weighting tables
- Which model for which climate and which season
- What the Greek data show
- Where the calculation is done
- How the divergence between the three models is read
- Where the data come from and when counting starts
- Documented requirements by species
- Sources
1. Why a model is needed and a thermometer is not enough
Winter dormancy in deciduous fruit trees is endodormancy: the inhibition is internal to the bud and is lifted only by chilling [1]. The question “how much chilling did the orchard get this winter” looks simple but conceals a difficulty: not all low temperatures contribute equally, and high temperatures may negate what has already accumulated. A model is precisely that: a function that converts hourly temperatures into accumulated chill.
Chilling requirements determine where a cultivar can be grown, and failure to meet them leads to reduced and degraded production, and in some cases to abandonment of the crop [2]. With climate change the question has become current again, because districts that were taken for granted no longer are.
2. The three models, with their weighting tables
2.1 Chilling Hours, the 0 to 7.2 °C model
The oldest and simplest. Every hour with a temperature between 0 and 7.2 °C counts as one chilling hour; anything else counts zero [3] [4]. The 7.2 °C figure is the 45 degrees Fahrenheit of the original study in Georgia, where thresholds of 700, 900 and 1,100 hours were tested [4].
Its basic problem: it subtracts nothing for warmth. A winter with 400 cold hours and ten days at 20 °C in between counts the same as a winter with 400 cold hours and no warm days, although physiologically the two are entirely different.
2.2 Utah Chill Units
The next step, from Utah State University. Each hour is weighted according to its temperature, and high temperatures subtract units [5]:
| Temperature of the hour | Units | What it means |
|---|---|---|
| up to 1.4 °C | 0 | Too cold, no contribution |
| 1.4 to 2.4 °C | 0.5 | Partial contribution |
| 2.4 to 9.1 °C | 1.0 | The optimum window |
| 9.1 to 12.4 °C | 0.5 | Partial contribution |
| 12.4 to 15.9 °C | 0 | Neutral zone |
| 15.9 to 18 °C | −0.5 | Negates chill |
| above 18 °C | −1.0 | Negates a full unit |
The idea that very low temperatures do not contribute is correct and important: below 1.4 °C the mechanism stops. The problem appears at the other end: the penalty is linear and unforgiving, so in a mild climate the total can fall to zero or even go negative, which is not physiologically tenable.
2.3 Dynamic Chill Portions
The most recent and the most different. It does not sum weights; it describes a two-step chemical process [6] [7]:
Step 2. Once the precursor reaches a critical amount, it converts irreversibly into one stable chill portion. From then on nothing undoes it.
Why the first step is fragile. The precursor forms in the cold, but while it remains unstable it is not yet banked: a high enough temperature dissolves it and the accumulation goes back. This is exactly where the three models part company. In Chilling Hours nothing is ever subtracted. In Utah it is subtracted linearly and permanently, including chill banked months earlier. In the Dynamic model only what has not yet been fixed is lost, and what has already become a portion is undone by no amount of heat.
The unit does not convert into hours. A chill portion is dimensionless: it counts how many times the two-step cycle was completed, not how long it was cold. No coefficient converts it into hours, not even approximately, because the same hour at 6 °C counts differently depending on what came before and after. That is why every cultivar requirement is written together with its model, and why a value in portions is never compared with a value in hours.
What this means for a Greek winter. Cold nights that build the precursor and mild days that lock it in are precisely the pattern of a Mediterranean winter. Utah counts that pattern as a loss and the Dynamic model counts it as a gain. That is where most of the distance between the two models in a Greek season comes from, and not from measurement error.
3. Which model for which climate and which season
The answer is not a matter of taste; it has been tested on real data.
| Conditions | Most suitable | Why |
|---|---|---|
| Cold continental winter, without warm spells | All three agree; Chilling Hours are adequate for practical use | With no warm hours there is nothing to subtract, so the simple sum gives the same picture as the complex models. |
| Mediterranean winter with alternating cold and warmth | Dynamic | It is the only one that handles the alternation correctly. On ten sweet cherry cultivars in Apulia it outperformed the other three [8]. |
| Mild or warm winter, marginal coverage | Dynamic, by a wide margin | Utah overestimates the destruction of chill and can produce absurdly low or negative totals. Chilling Hours, conversely, overestimate the accumulation. |
| Comparing years with each other | Dynamic | It gives more homogeneous accumulation across years, so its values are more comparable [9]. |
| Predicting bloom date | Dynamic | On 14 peach and nectarine cultivars at 11 sites in five countries, it gave better predictions than Utah, Positive Utah and Chilling Hours [9]. |
| Older cultivar literature | Necessarily Chilling Hours | Most historical requirement figures were published in hours. To be compared with a measurement, the measurement has to be made in the same model. |
4. What the Greek data show
The Department of Deciduous Fruit Trees of ELGO-DIMITRA at Naoussa has calculated chill accumulation for locations in Greece and Cyprus using different models, and publishes a spreadsheet that computes all three models from hourly values [2]. It is the same set of three that the tool follows.
Naoussa also took part in the European EUFRIN network, where accumulation ranged from 45 chill portions at Murcia-Torre Pacheco in Spain to 97 to 98 portions at Cuneo in Italy and Bucharest. Bloom was earliest in the moderately cold regions and 7 to 11 days later in the warmer locations of Rome and Naoussa, an indication that rest completion is delayed there [9].
5. Where the calculation is done
The three calculations and their comparison are not inside the article. They live in a separate tool, so that it can be updated without rewriting the text and used without having to read the theory first.
Chilling hours, units and portions, and insect degree-days (in Greek)
It accepts hourly temperatures or daily minimum and maximum, runs all three models on the same data, and gives the percentage of the requirement met when the cultivar requirement is supplied. It also draws directly from the stations of the National Observatory of Athens, so for the areas covered no copying of data is needed at all.
6. How the divergence between the three models is read
The value of running all three models on the same series is not to find the right number. It is that the distance between them describes the season.
7. Where the data come from and when counting starts
Sources of hourly temperatures
- An on-site weather station or data logger. The best solution, because chill differs substantially over a few kilometres and with elevation. Most loggers record at ten-minute intervals; conversion to hourly values is needed, and a ready-made spreadsheet exists for it [2].
- Station networks. Useful, subject to the distance and the difference in elevation from the block.
- Daily minimum and maximum. When nothing else is available. The tool accepts this format too, generating hourly values with a sine curve.
When counting starts
There is no calendar date. The start of accumulation is defined operationally as the date from which chilling hours are recorded consistently [2], in central Macedonia, typically within the second half of November. Counting closes when the cultivar's requirement is met or, in practice, at bud swell.
Sources: 2
8. Documented requirements by species
Values are always given with their model, because without it they mean nothing. None of them was measured in Greece: the general range for sweet cherry comes from literature cited in a Chilean study [11], the values for Burlat and Ferrovia from Apulia in Italy [8], and the values for kiwifruit Hayward from Alabama in the United States [12]. The Greek values come from the Department of Deciduous Fruit Trees at Naoussa [2].
| Species and cultivar | Requirement | Model | Source |
|---|---|---|---|
| Sweet cherry, general range | 520 to 1,320 | Chilling Hours | [11] |
| Sweet cherry ‘Burlat’, early | 58 | Dynamic portions | [8] |
| Sweet cherry ‘Ferrovia’, late | 84 | Dynamic portions | [8] |
| Kiwifruit ‘Hayward’ | 750 to 800 | Richardson units | [12] |
| Kiwifruit ‘Hayward’, adequate budbreak | 900 | Chilling Hours | [12] |
| Kiwifruit ‘Hayward’, maximum flowering | 1,150 | Chilling Hours | [12] |
Values for peach, nectarine and apricot under Greek conditions have been published by the Naoussa department and are found in the works listed at source [2]; they are not reproduced here cultivar by cultivar, because those figures are updated and the right thing is to take them from the primary source.

For the detailed discussion of sweet cherry (requirements, dormancy-breaking agents, the 70% rule and what is permitted in Greece) there is a separate article: Breaking dormancy in sweet cherry. For kiwifruit, where the bud mechanism is entirely different: Kiwifruit bud physiology and flower differentiation.
9. Sources
The numbers in the text refer to the list below.
- [1] Lang, G.A., Early, J.D., Martin, G.C. & Darnell, R.L. (1987). Endo-, para- and ecodormancy: physiological terminology and classification for dormancy research. HortScience 22:371-377. Source for the definition of endodormancy and for the fact that it is lifted only by chilling.
- [2] Winter dormancy of deciduous fruit and nut trees. Department of Deciduous Fruit Trees, Institute of Plant Breeding and Genetic Resources, ELGO-DIMITRA, Naoussa, Greece. Source for the consequences of unmet chilling requirements, for the spreadsheet that computes the three models from hourly values, for the definition of the start of accumulation as the date from which chilling hours are consistently recorded, for the 70% threshold, and for the published requirements of Greek cultivars.
- [3] Bennett, J.P. (1949). Temperature and bud rest period. California Agriculture 3(11), pp. 9 and 12. Source for the definition of the chilling hour as an hour with a temperature between 0 and 7.2 °C.
- [4] Weinberger, J.H. (1950). Chilling requirements of peach varieties. Proceedings of the American Society for Horticultural Science 56:122-128. Source for the 45 °F threshold and for the experimental levels of 700, 900 and 1,100 hours.
- [5] Richardson, E.A., Seeley, S.D. & Walker, D.R. (1974). A model for estimating the completion of rest for ‘Redhaven’ and ‘Elberta’ peach trees. HortScience 9(4):331-332. Source for the entire Utah weighting table, with the boundaries 1.4 / 2.4 / 9.1 / 12.4 / 15.9 / 18 °C and the weights 0 / 0.5 / 1 / 0.5 / 0 / −0.5 / −1.
- [6] Fishman, S., Erez, A. & Couvillon, G.A. (1987). The temperature dependence of dormancy breaking in plants: mathematical analysis of a two-step model involving a cooperative transition. Journal of Theoretical Biology 124(4):473-483. Source for the two-step mechanism, the unstable precursor and the irreversible conversion.
- [7] Erez, A., Fishman, S., Linsley-Noakes, G.C. & Allan, P. (1990). The dynamic model for rest completion in peach buds. Acta Horticulturae 276:165-174. Source for the formulation of chill portions in the form used today.
- [8] Palasciano, M. & Gaeta, L. (2017). Comparison of different models for chilling requirements evaluation of sweet cherry cultivars in a Mediterranean area. Acta Horticulturae 1161:405-410. Source for the comparison of four models on ten sweet cherry cultivars in Apulia, for the superiority of the Dynamic model in a Mediterranean climate, and for the values of 58 and 84 portions.
- [9] Drogoudi, P., Cantín, C.M., Brandi, F., Butcaru, A., Terrer, J.C., Cutuli, M., Foschi, S., Galindo, A., García-Brunton, J., Luedeling, E. et al. (2023). Impact of chill and heat exposures under diverse climatic conditions on peach and nectarine flowering phenology. Plants 12(3):584. Source for the 45 to 97 to 98 portions across eleven European sites, for the 7 to 11 day delay in Rome and Naoussa, for the superiority of the Dynamic model in both homogeneity and bloom-date prediction over Utah, Positive Utah and Chilling Hours, and for the lower prediction success in low-chill cultivars.
- [10] Luedeling, E. chillR: Statistical Methods for Phenology Analysis in Temperate Fruit Trees, source code of the temperature models, CRAN package. Source for the exact parameters and algorithms of the three models as implemented in the tool, and for the author's explicit recommendation against using the Utah and Chilling Hours models in warm climates.
- [11] Ardiles, M. & Ayala, M. (2017). An alternative dormancy-breaking agent to hydrogen cyanamide for sweet cherry (Prunus avium L.) under low chilling accumulation conditions in the Central Valley of Chile. Acta Horticulturae 1161:423-430. Source for the range of 520 to 1,320 chilling hours in sweet cherry.
- [12] Sibley, J.L., Dozier, W.A., Pitts, J.A., Caylor, A.W., Himelrick, D.G. & Ebel, R.C. (2005). Kiwifruit cultivars differ in response to winter chilling. Small Fruits Review 4(4):19-29. Source for the 750 to 800 Richardson units and for Caldwell's 900 and 1,150 hours in kiwifruit ‘Hayward’.
Photograph: Pastopoulos Agronomics archive.
Related articles

Nutrient antagonisms and synergies, with a per-element tool
The arrow diagram in every fertiliser leaflet does not stand up scientifically. The antagonisms are real, but they act on two separate levels, in the soil and inside the plant, and the same element can be antagonistic on one and synergistic on the other. With a tool showing the documented relationships of each element.
Zeolite in agriculture: what is documented and what is not
It is a cation exchanger, it holds ammonium and potassium, not nitrate. The rates that work are tens of tonnes per hectare, not hundreds of kilos. And erionite is a Group 1 carcinogen.
Leonardite in agriculture: properties, rates and what the law says
Leonardite is oxidised lignite with up to 85% humic acids, but pH below 3, up to 6% sulphur and almost no phosphorus. What the analyses and meta-analyses show, where it delivers and where it does not, and what Regulation (EU) 2019/1009 and the organic farming rules require.