
Nutrient deficiencies: what leaves show, with a symptom ranking tool
Savvas Pastopoulos, Agronomist MSc, Pastopoulos Agronomic P.C., Neos Mylotopos, Pella, Greece
A yellow leaf does not say which element is missing. It says where the symptom sits, how it is distributed across the blade, and how sharp the boundary is between the green and the yellow, and from those three things comes a hypothesis, not a diagnosis. What follows explains the mobility rule on which visual diagnosis rests, shows the three cases where that rule collapses in fruit trees, provides a tool that ranks candidate deficiencies from the symptoms, and explains why the last step is always the analysis.
- Leaf symptoms, and when they can lead to the wrong conclusion
- The mobility rule
- The three cases where the mobility rule does not hold in fruit trees
- The five symptom types
- What each element looks like in fruit trees
- The ranking tool
- Symptoms that resemble nutrient deficiencies
- The iron chlorosis paradox, when analysis does not help
- Leaf analysis: when, how, and the sufficiency ranges
- The steps followed for a sound deficiency diagnosis
- The key points
- Sources
1. Leaf symptoms, and when they can lead to the wrong conclusion
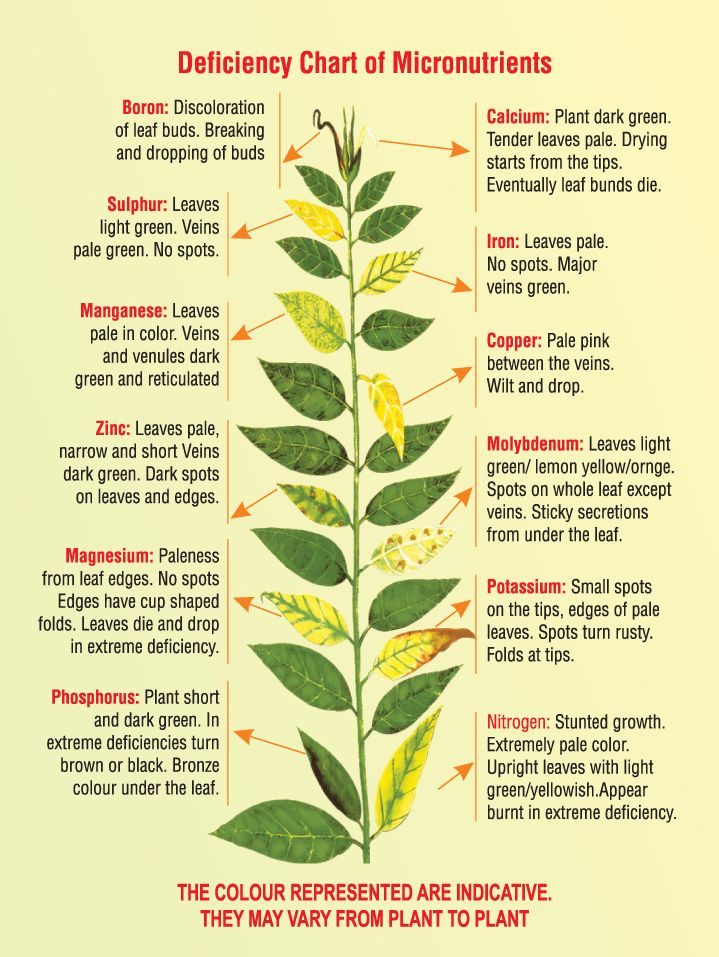
When a nutrient runs short, the function that depends on it stops first. Because every element has a different role, magnesium is the centre of the chlorophyll molecule, boron takes part in the cell wall, zinc in internode elongation, each deficiency leaves a different fingerprint [2]. That is the theoretical foundation of visual diagnosis.
The problem is that the fingerprint is not unique. The formal list of limitations, as Montana State University sets it out, has six points [2]:
| Limitation | What it means in the field |
|---|---|
| Many symptoms look alike | Nitrogen and sulphur give a nearly identical picture; they differ only in position and in the intensity of the yellow |
| Multiple deficiencies at once | Two deficiencies together do not give the sum of the two pictures. An excess of phosphorus induces zinc deficiency |
| Differences by species and cultivar | The same deficiency looks different in apple and in peach, and different again in two apple cultivars |
| Pseudo deficiencies | Disease, drought, excess water, herbicide residues, insects and soil compaction all give similar pictures |
| Hidden hunger | The tree can be deficient with no visible symptom at all, while already losing yield |
| Photographs show the ideal | Textbook images come from plants grown under controlled conditions. In the field they are rarely that clean |
List of limitations after McCauley and co-workers [2].
2. The mobility rule
The one piece of information that makes visual diagnosis possible is the position of the symptom on the tree, and the reason is purely physiological.
Some elements move within the plant through the phloem. When they start to run short, the tree withdraws them from the old leaves and sends them to the new ones, sacrificing old tissue to keep the new growth going. The symptom therefore appears first on the old, lower leaves. Other elements, once built into a tissue, never leave it again. The tree cannot recycle them, so the new growth is left exposed and the symptom appears on the young, upper leaves [2] [1].
| Category | Elements | Where the symptom appears |
|---|---|---|
| Mobile | Nitrogen, phosphorus, potassium, magnesium, molybdenum, chloride | Old, lower leaves first |
| Intermediate | Zinc | Middle leaves first, then both extremes |
| Immobile | Calcium, sulphur, iron, manganese, copper, boron, nickel | Young, upper leaves first |
Classification after McCauley and co-workers [2]. The exceptions that apply specifically to fruit trees are analysed immediately below.
3. The three cases where the mobility rule does not hold in fruit trees
The handbooks in circulation are written mainly for arable crops. Three of their rules do not transfer to tree fruit, and all three concern exactly the elements that are most often short in Mediterranean orchards.
First: manganese appears on the old leaves
The general rule places manganese among the immobile nutrients, so it expects the symptom on the young leaves. In fruit trees, however, the handbook of the three Pacific Northwest universities is explicit: "usually only older leaves are affected", and only in very severe deficiency does it extend to the young leaves as well [7].
Second: boron is mobile in fruit trees
Here the exception comes with a mechanism. Boron is, according to Brown and Shelp, the element whose mobility varies between species more than that of any other nutrient: in many species it is practically immobile, in others it circulates freely [9]. The division is not arbitrary. In species that produce polyols in their leaves, boron forms complexes with them and travels normally in the phloem [10].
Third: calcium deficiency does not show on the leaf, it shows on the fruit
Calcium travels exclusively in the transpiration stream, in the xylem, and is not redistributed. The fruit, however, transpires very little and loses that capacity early, while the leaf transpires at full power until the end. Leaf calcium does not predict fruit calcium. In fruit trees, calcium deficiency shows almost always in the fruit, bitter pit, cracking, softening, and rarely gives a clear picture on the leaf. The subject is analysed in the article Calcium and its importance for plants (in Greek) and, specifically for sweet cherry, in Calcium and postharvest physiology in sweet cherry.
4. The five symptom types
Every nutrient deficiency, regardless of element and species, expresses itself through five forms [1] [2]. Recognising the form is the first step, before the question of which element is at fault is even raised.
| Form | Description | Elements that give it |
|---|---|---|
| Stunting | Smaller leaves and shorter shoots, with normal colour | Potassium, copper, molybdenum, zinc |
| Chlorosis | Generalised yellowing, absence of chlorophyll across the whole blade | Nitrogen and potassium on old leaves; sulphur, copper, nickel on young |
| Interveinal chlorosis | The veins stay green, the blade between them yellows | Iron, manganese, magnesium, zinc, boron, nickel |
| Anthocyanin | Purple or red colouring from anthocyanin accumulation | Mainly phosphorus, and to a lesser degree nitrogen, potassium and magnesium. It is the least reliable of the five forms, because the same purple is produced by cold, virus infection, root damage and the cultivar itself, with no deficiency at all |
| Necrosis | Tissue browns and dies, at an advanced stage of deficiency | Phosphorus, potassium, nitrogen, chloride, boron, iron |
Classification after Colucci [1] and McCauley and co-workers [2].
The distinction that decides most cases
In Mediterranean orchards the commonest picture is interveinal chlorosis, and the question is almost always "iron or manganese?". Both give a yellow blade with green veins, but they separate on seven points. The first is decided on the leaf itself, the rest from position, season and the history of the block. None of them is sufficient on its own; it is the coincidence of three or four that gives the answer:
| Feature | Iron | Manganese |
|---|---|---|
| Vein-to-blade boundary | Sharp. A fine network of green veins, down to the smallest ones, on a clean yellow background. The green stops abruptly at the edge of the vein | Diffuse. A broad green band on either side of the vein, fading gradually into the yellow. The small veins do not stand out |
| Position on the tree | Young, upper leaves. The old, low leaves stay green | Older leaves first, in fruit trees, that is the reverse of the general rule. It reaches the young leaves only in severe deficiency |
| Distribution within the block | In zones, where the soil is more calcareous, wetter or more compacted. It often differs from tree to tree, and within the same tree from limb to limb | A more uniform picture within the block, without the zoned distribution of iron |
| Season of appearance | From the start of growth, on the first leaves of the new flush, and worse after a wet spell | Later, from late spring and through the summer, as the foliage ages |
| Effect of wetness | Worsened by over-irrigation, a high water table and poor root aeration | Not worsened by wetness |
| Effect of nitrogen fertilisation | Makes it worse | Neutral |
| Frequency on Greek soils | Very common, because most soils are calcareous and alkaline | Clearly less common than iron, although the same high pH favours both |
| What leaf analysis says | It may give no answer. Chlorotic leaves often return a normal total iron figure, for the reasons set out in section 8 | It gives a more useful answer than for iron, and comparing chlorotic with healthy leaves from the same block clears the picture |
Distinction after Benson and co-workers [7] and McCauley and co-workers [2].
5. What each element looks like in fruit trees
The table below describes symptoms as they appear on fruit trees, not on arable crops. Where the picture differs by species, the species is named.
| Element | Position | Picture in fruit trees |
|---|---|---|
| Nitrogen | First on the old, low leaves. With prolonged deficiency the whole tree goes pale | Leaves smaller and pale green, short shoots, a reddish tinge to the bark. Reduced fruit size but better colour. In peach, severe deficiency gives reddish leaves with necrotic spots that drop out, leaving a mild shot-hole effect [7] |
| Sulphur | On the young leaves at the top, while the old ones stay green | Uniform yellow, more intense than nitrogen, without spots or striping. Otherwise the picture is similar [7] |
| Potassium | On the old leaves, and first on the limbs carrying the heaviest crop | Scorch starting at the margin and advancing towards the base, with the midrib staying green. In Comice pear, purplish-brown scorch on spur leaves. Commoner on heavy, poorly drained soils and with excessive crop load [7] |
| Magnesium | On the old leaves, from the base of the shoot upwards, late in the summer | Yellow areas between the veins or along the margins in late summer, which may become necrotic. Heavy premature leaf drop, severely affected trees lose more than half their leaves by harvest and the fruit does not reach marketable size. In fruit trees it is mainly an apple problem, worse on trees with a heavy crop [7] |
| Iron | On the young leaves at the top. Often on part of the tree only, or on individual limbs | Yellow blade with a fine network of green veins. In severe cases all the green is lost and dead tissue develops around the edges and within the blade. May affect only part of the tree. Worse on alkaline soils, with over-irrigation, a high water table or a tight subsoil. Nitrogen fertilisation makes it worse [7] |
| Manganese | On the old leaves first, against the general rule of mobility | Yellow blade with the veins and the band around them staying green. The yellowing intensifies as the deficiency deepens; only then does it reach the young leaves. On alkaline soils, but without the aggravation by wetness. Less common than iron [7] |
| Zinc | On the middle and upper leaves, at the end of last year's growth | "Rosette" or "little leaf": internodes shorten drastically and the leaves cluster in a whorl at the shoot tip, or keep normal spacing but are much smaller. In stone fruit, chlorosis is added; in severe deficiency the leaves are entirely yellow, dwarfed and narrower than normal. In pear, many buds fail to open [7] |
| Boron | On the fruit first, and only later on the young leaves and the shoot tips | In apple, pear and apricot: cork development, dry withered tissue, a rough scabby skin that cracks, deformity. Apricots may crack without noticeable cork. Then follow: shoot dieback, buds failing to break in spring, rosettes of small leaves in apple, blossom blast in pear. In plum and cherry the leaves are small, narrow, pinched at the base, with an enlarged midrib and a glossy surface; the shoots short, thin, often leafless with green bark [7] |
| Copper | At the tips of the current season's shoots, towards the end of the first flush | "Wither tip": the shoot grows normally in spring and, towards the end of the first flush of growth, the terminal leaves yellow, wither and fall, with dieback of the tip over part or all of the tree. In the source, which covers the Pacific Northwest of the United States, the symptom is placed in mid-June; under Greek conditions it is expected earlier. Affects apple and pear [7] |
| Calcium | On the fruit. On the foliage only rarely, and then on the young leaves and the terminal bud | On the leaf: young leaves distorted and abnormally dark, dry brittle tips, death of the terminal bud. In practice, however, it shows in the fruit [2] |
The descriptions come from the handbook of Washington State, Oregon State and University of Idaho [7], supplemented by the Montana State University series [2]. They do not constitute a diagnosis. The same symptom appears differently by species, cultivar, severity and season. Confirmation always requires leaf analysis, sampled at the right time and from the right leaf, as set out in section 9. The visual picture shows the analysis where to look, it does not replace it.
6. The ranking tool
The tool below takes the position and the type of the symptom, together with any additional features observed, and returns a ranking of candidate deficiencies with a relative score. Each result comes with what needs to be checked in order to confirm it.
It is a classifier of hypotheses. It scores how compatible the picture described is with each of the known deficiency pictures in fruit trees, based on the published descriptions.
It is not a diagnosis. It does not know the history of the block, the pH, the active lime, the cultivar, the rootstock, the crop load, the spray programme, the drainage, or what grew there before. It does not see the tree. It does not rule out disease, insects, virus, herbicide, salinity or root damage, causes that give exactly the same pictures.
It does not suggest a fertiliser, a rate or a product. Moving from suspicion to intervention passes necessarily through analysis and through an on-site assessment by an agronomist. Fertilising on a guess costs money at best, and causes antagonisms, toxicities or pollution at worst.
Ranking candidate deficiencies from symptoms
Choose the position and the type of symptom. The remaining fields improve the ranking but are not required.
The ranking is derived from the published descriptions in sources [1] [2] [3] [7]. The percentage expresses relative compatibility with the description, not probability and not certainty.
7. Symptoms that resemble nutrient deficiencies
This is the section that makes the difference between a correct decision and an expensive one. The causes below give pictures identical to nutrient deficiencies and are, in Mediterranean orchards, commoner than several real deficiencies.
Herbicides
There is a visual criterion that separates the two chloroses. Herbicide chlorosis gives a bright yellow to white blade with sharply defined, vivid green secondary veins. Nutritional chlorosis gives a gradual fading of the green towards the midrib, without that sharpness in the secondary veins [3].
| Active substance | Picture | What it mimics |
|---|---|---|
| Glyphosate | Short internodes, stunting with abundant lateral shoots, distorted arrow-shaped leaves, chlorosis on new growth. Symptoms are delayed up to two weeks and may appear the following spring if the application was made in autumn [3] | Zinc, an almost identical picture |
| Diuron | Chlorosis of the veins themselves [3] | An unusual pattern, but confused with virus |
| Simazine | Chlorosis of the blade with the veins staying green [3] | Iron and manganese |
| Glufosinate, paraquat | Chlorotic and necrotic spotting at the points of contact [3] | Chloride, fungal leaf spots |
| 2,4-D and dicamba | Severe distortion, cupping, twisted petioles. They appear within hours to a few days [3] | Boron, calcium |
Salinity and toxicities
| Cause | Distinguishing feature |
|---|---|
| Salinity, chloride, sodium | Browning from the tip along the margin, with a slender yellow halo between the dead and the green tissue [4]. Potassium does not leave that halo |
| Boron toxicity | In peach, necrotic spots along the midrib, which drop out leaving holes. In young trees on light soils, gum oozing and dieback [7] |
| Manganese toxicity | "Apple measles": a bark disorder on trunk and branches, only at a soil pH below 5. Note: a similar bark condition is caused by boron deficiency [7] |
| Arsenic | In old blocks where lead arsenate was used: in peach and apricot, red spots along the margins and between the veins that drop out leaving a shot-hole, leaves with ragged edges and premature leaf fall [7] |
The non-nutritional causes
- Root disease and waterlogging. The tree cannot take up the nutrients that are present. It gives chlorosis, stunting, wilting. The key is the spatial pattern: individual trees or patches, not a whole zone.
- Viruses and phytoplasmas. Mosaics and rings that do not follow the mobility rule, often on a single branch.
- Spring frost. It gives pictures confused with both a deficiency and herbicide injury [3].
- Soil compaction, drought, excess water, insects [2].
8. The iron chlorosis paradox, when analysis does not help
The natural next move after a visual suspicion is a leaf analysis. For one element, however, and exactly the one that is most often short in the Mediterranean, leaf analysis does not work.
Iron deficiency on calcareous soils does not result from low iron in the soil but from the plant's impaired acquisition and use of the metal; the main culprit in the Mediterranean is the bicarbonate ion. It is estimated that 20 to 50% of fruit trees in the Mediterranean basin suffer from iron chlorosis [6].
The same conclusion arrives from the practical side: Washington State University notes that total leaf iron shows little correlation with uptake, and that the best indicators are the visual symptom and the soil pH [5]. Two independent sources, one research and one applied, arrive at the same place.
What works instead
- Soil pH and active lime. The most reliable predictor, and it is checked before planting, while a tolerant rootstock can still be chosen [6].
- Visual scoring or SPAD. Scales of 0 to 5, or a transmittance measurement at 650 and 950 nm that quantifies chlorophyll [6].
- Flower analysis. The most important development: it is done in spring, early enough for a correction to work. In peach, an iron concentration in the flowers below 160 mg/kg dry weight is associated with a high probability of chlorosis later. An even more stable indicator is the K:Zn ratio in flowers at full bloom: above 450 chlorosis is likely, below 375 unlikely [6].
9. Leaf analysis: when, how, and the sufficiency ranges
What it answers and what it does not
| It answers | It does not answer |
|---|---|
| Which elements are present in adequate, deficient or excessive amounts | Why an element is deficient |
| What the tree actually took up, as opposed to what is in the soil | How much should be applied |
| A warning of an approaching deficiency before any symptom shows | Which product or form to use |
Distinction after Sallato [5] and Penn State Extension [8]. Note that crop size markedly affects the values: an excessive crop reduces the percentage of potassium and increases calcium and magnesium [11].
The sampling rules
- Timing: from mid-July to mid-August, when concentrations are most stable. Earlier, the tree is actively transporting nutrients into the leaves; later, it is withdrawing them [8].
- Which leaf: a recently mature leaf from the middle of a shoot or spur carrying no fruit, from mid-canopy [5].
- How many: 60 to 70 leaves, with no more than two per shoot [8].
- Uniformity: one cultivar, one rootstock, one soil type, one age. Never mixed [8].
- Comparison: where there is a problem, two samples, one from healthy and one from symptomatic trees [8].
- Frequency: every block at least once every three years. For the grower, divide into thirds and sample one third each year [8].
- Washing: not needed for macronutrients. When boron, copper, manganese or zinc are to be measured, the leaves are washed in water with a little detergent and rinsed twice in distilled water [11].
Sufficiency ranges for the main species
The values below apply to recently mature leaves sampled in July to August, as a percentage of dry weight for macronutrients and in mg/kg for micronutrients.
- Below the range. An indication of deficiency. Together with a symptom in the foliage it justifies intervention, and the further the value lies below the lower limit, the more urgent it is.
- At the lower edge of the range. A borderline case. It does not prove deficiency, but neither does it exclude it. It is judged together with the symptoms, the crop load of the season and a repeat analysis the following year.
- Within the range. No indication of deficiency for that nutrient. It does not mean the fertiliser programme is optimal, nor that a higher rate would produce more fruit.
- Above the range. Excess, antagonism with another nutrient, or contamination of the sample by a spray, as with manganese and zinc.
| Element | Apple | Pear | Peach | Cherry |
|---|---|---|---|---|
| Nitrogen (%) | 1.80 to 2.80 | 1.60 to 2.40 | 2.50 to 3.40 | 2.30 to 3.30 |
| Phosphorus (%) | 0.15 to 0.30 | 0.18 to 0.26 | 0.15 to 0.30 | 0.23 to 0.38 |
| Potassium (%) | 1.20 to 2.00 | 0.20 to 2.00 | 2.10 to 3.00 | 1.00 to 1.90 |
| Calcium (%) | 1.30 to 3.00 | 1.30 to 3.00 | 1.90 to 3.50 | 1.60 to 2.60 |
| Magnesium (%) | 0.20 to 0.40 | 0.30 to 0.60 | 0.20 to 0.40 | 0.49 to 0.65 |
| Manganese (mg/kg) | 22 to 140 | 20 to 200 | 19 to 150 | 18 to 150 |
| Iron (mg/kg) | 40 to 100 | 50 to 400 | 51 to 200 | 50 to 250 |
| Copper (mg/kg) | 6 to 25 | 6 to 25 | 6 to 25 | 6 to 25 |
| Boron (mg/kg) | 35 to 80 | 35 to 80 | 25 to 50 | 39 to 80 |
| Zinc (mg/kg) | 20 to 200 | 20 to 200 | 20 to 200 | 20 to 200 |
Sufficiency ranges from the Penn State Tree Fruit Production Guide [8]. The values are indicative and do not constitute a fertiliser recommendation. They apply to that specific sampling methodology; a different date or leaf type gives different values. The nitrogen range is deliberately broad because it depends on tree age, cultivar and the intended use of the fruit.
10. The steps followed for a sound deficiency diagnosis
Visual observation is the first step, not the last. The sequence below keeps the cost low and the probability of error low as well.
- Record before anything else. Which species and cultivar, where in the block, on what topography and soil type, when the symptom first appeared, on which leaves. The locations are flagged or logged with GPS and monitored [2].
- Spatial pattern. A zone, an edge, scattered trees or the whole block? That single observation rules out half the hypotheses before any analysis begins.
- History. Sprays over the last three weeks, herbicides own and neighbouring, irrigation, crop load, what happened at the same spot last year.
- Visual hypothesis. Position, form, vein-to-blade boundary. This is where the tool in section 6 comes in.
- Check the fruit and the cambium. For boron and calcium the information is not in the leaf. For shoot dieback, the colour of the cambium.
- Analysis. Leaf for most elements, soil for pH and active lime, fruit for calcium. A paired healthy-symptomatic sample. Never within 15 days of a micronutrient spray.
- Interpretation by an agronomist, with the data of that particular block in front of them.
- Intervention, if one is warranted. And a repeat analysis the following year to see whether it worked.
11. The key points
Ten conclusions
- The position of the symptom is the first piece of information. Mobile elements on the old leaves, immobile on the young, zinc on the middle ones [2].
- In fruit trees manganese breaks the rule and appears on the old leaves [7].
- Boron is mobile in apple, pear and stone fruit, because they produce sorbitol; this is why the first sign is in the fruit and not in the leaf [10] [7].
- Calcium cannot be read from the leaf. It shows in the fruit.
- Iron and manganese are separated by the boundary: sharp for iron, diffuse for manganese [2] [7].
- Nitrogen and sulphur cannot be told apart by eye, only position and intensity give a hint, and only analysis gives an answer [2].
- Glyphosate mimics zinc, simazine mimics iron, salinity mimics potassium [3] [4].
- For iron, leaf analysis does not work. Chlorotic leaves often measure more iron than green ones [6] [5].
- Mancozeb, ziram or copper sprays invalidate the manganese, zinc and copper values of the analysis [8].
- A visible symptom means the damage has already been done [2]. The value of analysis is preventive.
- Nutrient antagonisms and synergies (in Greek), why an excess of one element causes the deficiency of another, with a per-element tool
- Calcium and its importance for plants (in Greek), why calcium is decided in the fruit and not in the leaf
- VPD: vapour pressure deficit, how transpiration determines which elements reach where
- Approved plant protection products (Greece), checking approvals before any intervention
12. Sources
The numbers in the text refer to the list below.
- [1] Colucci, I. How To Diagnose Plant Nutrient Deficiencies Using Leaf Symptoms. SoilNOW, Cornell University College of Agriculture and Life Sciences, 2022. Source for the five symptom types and for the general principle of diagnosis from the position of the symptom.
- [2] McCauley, A., Jones, C. and Jacobsen, J. Plant Nutrient Functions and Deficiency and Toxicity Symptoms. Nutrient Management Module No. 9, 4449-9, Montana State University Extension, 2009. Main source for the classification of mobile and immobile nutrients, for the dichotomous identification key, for the six limitations of visual diagnosis, for the separation of iron from manganese by the vein-to-blade boundary, and for the intermediate mobility of zinc.
- [3] Doohan, D., Dami, I. and Bordelon, B. Herbicide Injury and the Problem of Spray Drift. ANR-0137, Ohio State University Extension, 2023. Source for herbicide symptoms that mimic nutrient deficiencies: glyphosate with short internodes and arrow-shaped leaves, diuron with vein chlorosis, simazine with blade chlorosis and green veins, the delay of up to two weeks in symptom expression, and the spatial signature of droplet drift as against volatilisation.
- [4] Hosier, S. and Bradley, L. Guide to Symptoms of Plant Nutrient Deficiencies. Publication AZ1106, The University of Arizona Cooperative Extension, 1999. Source for the methodology of visual diagnosis, for the limitations when more than one problem is present, and for the distinguishing feature of salinity: marginal browning separated from the green tissue by a slender yellow halo.
- [5] Sallato, B. Leaf Tissue Analysis. WSU Tree Fruit, Washington State University, updated June 2021. Source for what leaf analysis does and does not answer, for the 15-day wait after a foliar spray, for the interpretation of a leaf-soil disagreement as an uptake problem, and for the finding that total leaf iron does not correlate with iron uptake.
- [6] Pestana, M., de Varennes, A. and Faria, E.A. (2003). Diagnosis and correction of iron chlorosis in fruit trees: a review. Food, Agriculture & Environment 1(1):46-51. Source for the estimate that 20 to 50% of fruit trees in the Mediterranean basin suffer from iron chlorosis, for Römheld's "chlorosis paradox", for the absence of correlation between leaf iron and the degree of chlorosis, for the role of the bicarbonate ion, for the unsuitability of the sampling date, and for flower analysis with the 160 mg/kg iron threshold and the K:Zn ratio of 375-450.
- [7] Benson, N.R., Woodbridge, C.G. and Bartram, R.D. Nutrient Disorders in Tree Fruits. PNW 121E, Pacific Northwest Extension Publication, Washington State University, Oregon State University and University of Idaho, 1994. The main source for symptoms specific to fruit trees: manganese on the older leaves, boron showing first in the fruit, the whiteness of the cambium that separates boron from winter injury, the "wither tip" of copper, magnesium as an apple problem with premature leaf drop, boron symptoms in plum and cherry, boron toxicity along the midrib, apple measles from manganese below pH 5, and arsenic toxicity in old orchards.
- [8] Orchard Nutrition: An Overview. Penn State Extension, with tables from the Penn State Tree Fruit Production Guide. Source for the sufficiency ranges for apple, pear, peach and cherry, for the July to August sampling rules, for contamination by fungicides containing manganese and zinc, for the precedence of leaf analysis over soil analysis with the exception of liming, and for the warning value of multi-year monitoring.
- [9] Brown, P.H. and Shelp, B.J. (1997). Boron mobility in plants. Plant and Soil 193:85-101. Source for the finding that boron varies in mobility between species more than any other essential nutrient, and that its retranslocation determines the expression of deficiency and toxicity symptoms.
- [10] Brown, P.H. and Hu, H. (1996). Phloem Mobility of Boron is Species Dependent: Evidence for Phloem Mobility in Sorbitol-rich Species. Annals of Botany 77(5):497-505. Source for the mechanism: in the genera Malus, Pyrus and Prunus, which produce sorbitol, boron moves freely in the phloem as a boron-sorbitol complex, while in species with little or no sorbitol it remains immobile.
- [11] Beutel, J., Uriu, K. and Lilleland, O. Leaf Analysis for California Deciduous Fruits. In: Soil and Plant Tissue Testing in California, Bulletin 1879, Division of Agricultural Sciences, University of California. Source for the leaf sampling methodology in deciduous fruit trees, for the need to wash leaves when micronutrients are to be measured, for the finding that leaves sprayed with micronutrients are not worth analysing, and for the effect of crop size on element concentrations.
- [12] Database of approved plant protection products and biocides, plantprotect.gr, with data from the database of the Greek Ministry of Rural Development and Food, and the register of approved fertilisers. Source for checking plant protection approvals and fertiliser marketing authorisations before any application.
Visual diagnosis of nutrient deficiencies is not a diagnosis. It is the formulation of a hypothesis. The tool in section 6 ranks hypotheses on the basis of published descriptions and does not replace laboratory analysis or an on-site assessment by a licensed agronomist. It does not know the history, the soil, the rootstock, the crop load or the spray programme of the particular block, and it does not see the tree.
The same symptom arises from many causes. Diseases, insects, viruses, herbicides, salinity, root asphyxiation, frost, drought and soil compaction all give pictures identical to nutrient deficiencies. A plant may also be deficient with no visible symptom at all. No intervention is justified by the visual picture alone.
No fertiliser recommendation follows from this article. The sufficiency values quoted are indicative, apply to a specific sampling methodology, and do not constitute a recommendation for application. Fertilising without analysis causes antagonisms between elements, toxicities, particularly with boron, whose sufficiency and toxicity ranges overlap, unnecessary cost and pollution.
Every fertiliser or soil improver is used in accordance with its marketing authorisation and its label. Plant protection products are used exclusively on the basis of national approvals and the product label [12]. The approvals in the plantprotect.gr databases are valid in Greece only; in every other country the corresponding national register applies.
For every foliar spray: spraying trees carrying fruit can cause fruit marking and leaf burn. A prior test on a limited number of trees is required, with the same product and the same rate, and a wait of 5 to 7 days before general application. Spraying is done in the late afternoon or early morning, never in a heatwave and never on foliage under water stress.
Every intervention is carried out at the user's own responsibility, following an on-site assessment by a licensed agronomist. Pastopoulos Agronomic P.C. accepts no liability for any damage arising from the use of the information or the tool in this article.
Related articles
Foliar sprays: the time of day, the reactions in the tank and the mixing order
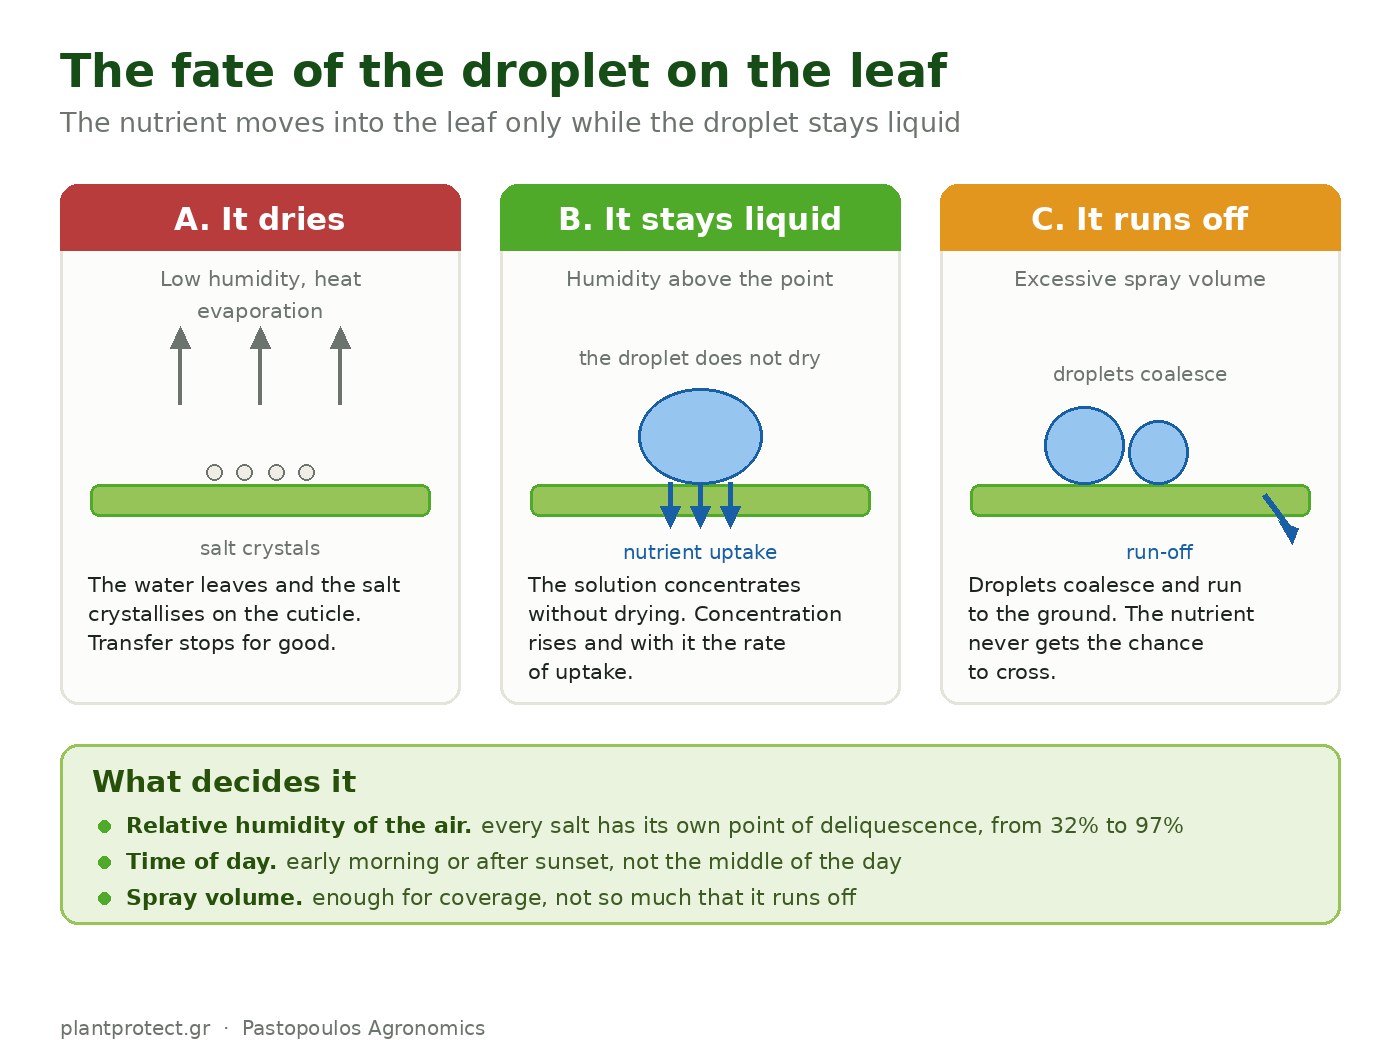
The nutrient moves into the leaf only while the droplet stays liquid, and relative humidity decides that. With the point of deliquescence by salt, the reactions of calcium with phosphates and sulphates, the optimum pH values, the tank loading order.
Attapulgite: what it actually does to soil, at what rate, and what its use costs
A Greek mineral with a specific surface area of 220 m2/g and an exchange capacity of 57 meq/100 g. What the field trials on sandy soils showed, why the rate threshold is 6,000 kg per hectare, what the IARC fibre classification means, which particle grade for which use, and why the rise in pH is the main argument against it on Mediterranean calcareous soils.

Boron in olive: foliar and soil application, rates and the toxicity threshold
The nutrient with the narrowest safety margin: 35 ppm separate sufficiency from toxicity. How boron moves inside the olive through mannitol, what the July leaf analysis shows, foliar and soil rates worked out per hectare, the trials that found no benefit, and a tool that separates deficiency from toxicity.