
Hydrological assessment before planting kiwifruit: four measurements anyone can make
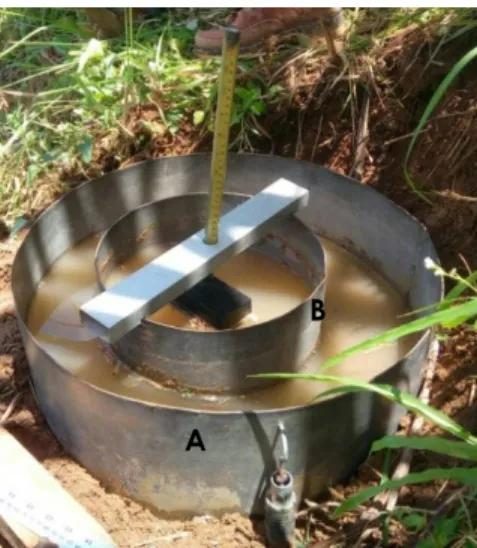
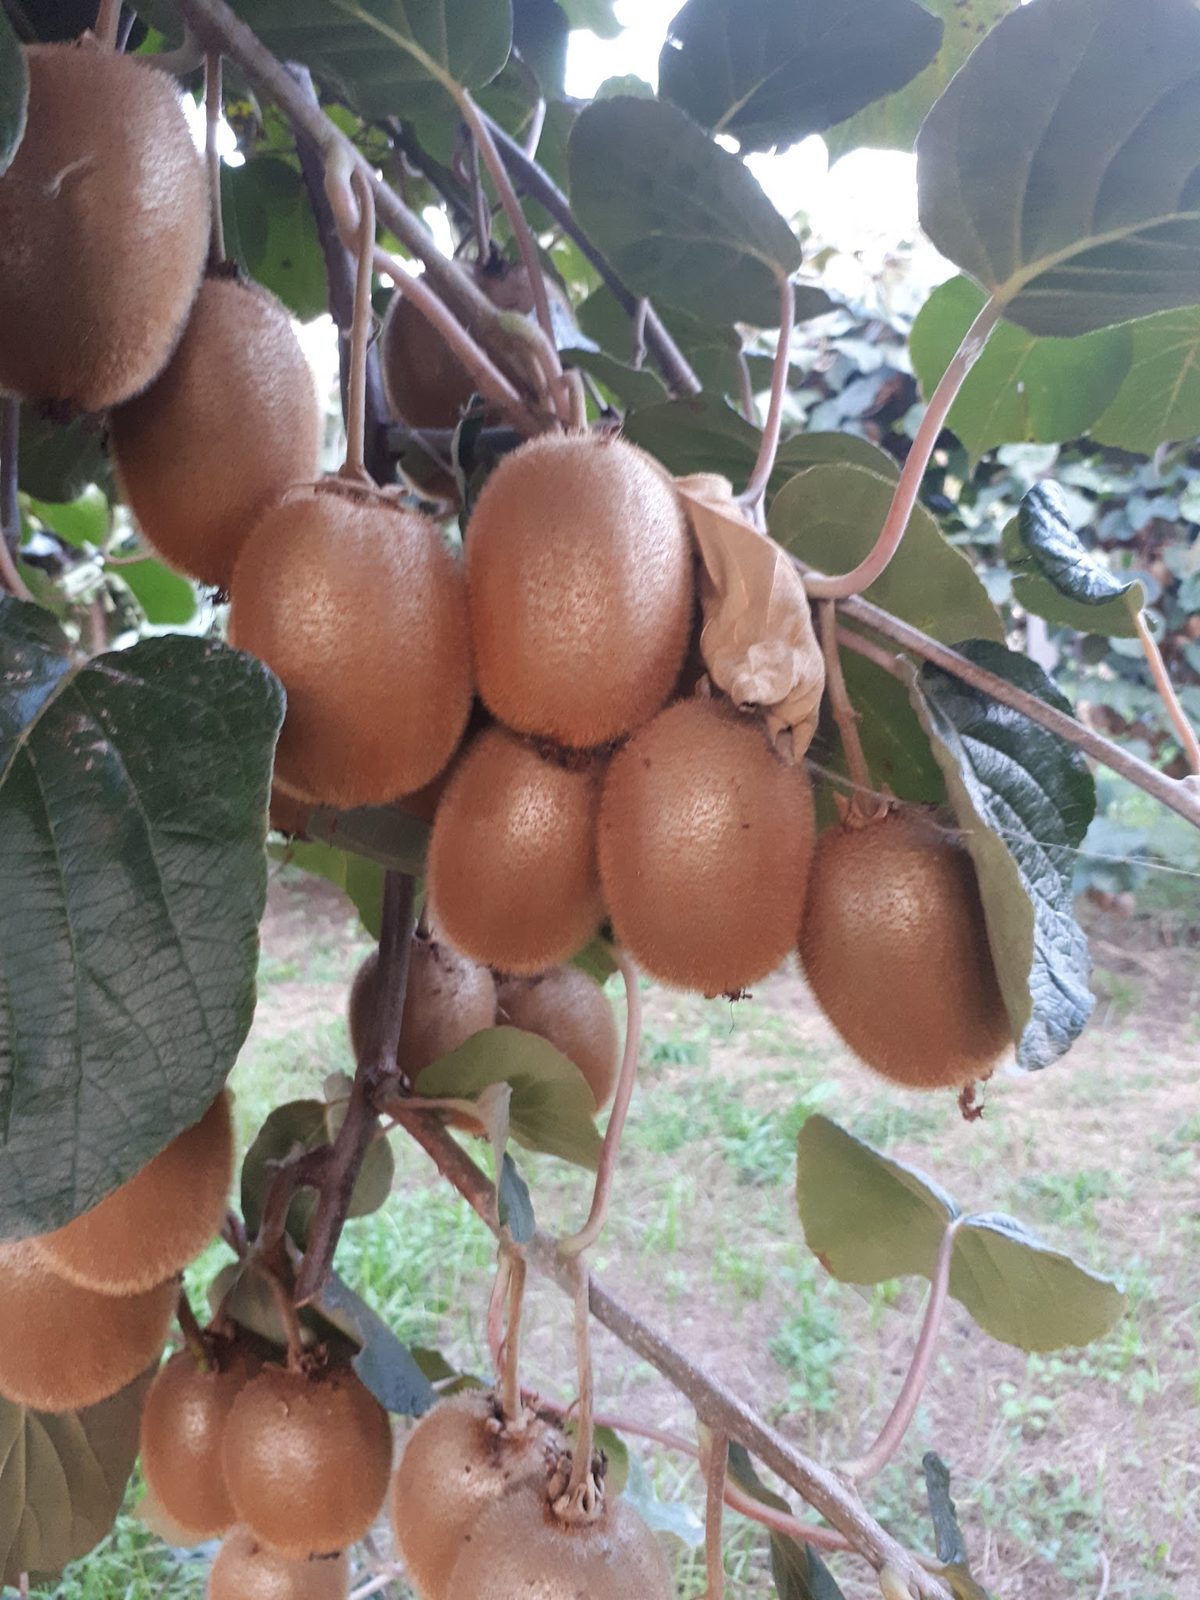
Figure 1. The question before every new kiwifruit planting is not what the analysis says, but how fast the water leaves this particular block and where it goes. Photograph: Savvas Pastopoulos.
Savvas Pastopoulos, Agronomist, Pastopoulos Agricultural Ltd
The article on the right soil for kiwifruit [7] stated that three analyses are needed before planting, not one, and that the third, the hydrological one, is nearly always omitted while being the one that shows whether the block will do. Here it is set out in full: which measurements are made, how they are made without equipment, and what the resulting numbers mean.
- Three different speeds, not one
- The soil pit, the diagnosis: where and why
- Ring infiltration test: how fast water enters
- Pit test: how fast it drains
- Observation pipe: where the water table is
- What the numbers mean for kiwifruit
- Why the dripper ponds: infiltration and irrigation
- When, where and how many times the measurement is made
- The decision
- Sources
1. Three different speeds, not one
“How fast the water leaves” is three different things, measured differently and failing differently. A block can pass two of them and be ruled out by the third.
| The question | What it answers | How it is answered |
|---|---|---|
| How fast does it enter? surface infiltration rate, millimetres per hour | How fast the water enters the soil from the surface [1] | Ring test a measurement, gives a number |
| How fast does it leave? from the soil volume of the root | How fast the water drains from a given depth | Pit test a measurement, gives a number |
| Where does it stop, and why? the structure of the profile | At what depth there is an obstacle, what kind it is, and how far the roots reached | Soil pit observation, gives no number |
| Where is the water table? and where does it rise to in winter | Whether the water comes from below, and whether there is an outlet for the drainage | Observation pipe and the colours of the profile |
The first two rows are measurements. They give a number. The third is a diagnosis. It gives an explanation. Both kinds are needed: the number shows whether there is a problem, the observation shows what it is and whether it can be corrected.
How each of them fails: in plain terms
1. The water does not even enter the soil
With rain or with irrigation, the water stands in pools on the surface instead of being absorbed. The soil type is not always to blame: the same block that soaked up water ten years ago now ponds.
What causes it: machinery passes on wet soil press down and close the pores of the surface. Raindrops on bare soil break up the aggregates and form a crust, a thin hard skin that seals the surface. And a fall in organic matter leaves the soil without stable structure [3].
How it is recognised: puddles that persist for hours after rain, water running downslope instead of entering, mud in the alleys. The good news is that this can be corrected, with organic matter, cover in the alleys and fewer passes.
2. The water enters, but stops somewhere below
The surface is exemplary, the water is absorbed at once, and everything looks fine, until the pit is opened. Somewhere at 40, at 70 centimetres or at one metre there is a layer the water will not pass.
What causes it: a natural clay pan; a compacted horizon from years of ploughing always at the same depth, known as a plough pan; or a layer of gravel and sand that breaks the capillary continuity.
What then happens: the water descends, hits the layer and sits on top of it, forming a perched water table inside the soil. The root is inside that water with nothing visible from above. It is the most insidious form of failure, because the block looks dry while it is drowning.
3. The water has nowhere to go, or comes from below
Here the problem is not inside the block but around and beneath it.
First case, there is no outlet: drainage pipes are laid, they collect the water, and then? If there is no ditch, stream or lower point for them to discharge into, the network simply moves the water around within the same block. It is decorative and it has cost full price.
Second case, and the worst: the groundwater table rises in winter and reaches the root zone. The water, in other words, does not come from the rain. it comes from below, upwards. In that case neither ridges nor drainage solve the problem, because the water table does not recognise the boundaries of the property [7].
2. The soil pit, the diagnosis: where and why
If only one of the four is done, this is the one. It costs an hour of excavator time and it shows things that appear on no analysis sheet.
The soil pit is not a test and it produces no number. It is observation. It does not show how fast the water moves. It shows where it moves, where it stops and why.
How it is done
- Two to three pits 1.5 to 2 metres deep are opened, at different points in the block, not three side by side. One at the highest point, one at the lowest, one in between.
- One face is cut clean and vertical, so that the layers are visible.
- The observation is made from inside the pit. The face is scraped with a spade so that fresh colour shows.
- Photographs with a tape measure alongside, for the depth scale.
What is read in the profile
| What is visible | What it means |
|---|---|
| Uniform brown or reddish-brown colour throughout the depth | Good aeration. The soil does not stay saturated for long periods |
| Grey or bluish colours | Permanent saturation. The soil is under reducing conditions. The iron has been reduced and the colour has been “washed out”. At that depth no kiwifruit root will live |
| Orange or rusty mottles within a greyish matrix | Seasonal fluctuation of the water table. The depth at which the mottles begin shows where the water rises to in winter, even if the digging is done in August in dry soil. It is the clearest indication in the whole profile |
| A dense, hard layer that resists the spade noticeably and breaks in plates rather than crumbling | A clay pan, a compaction horizon from old ploughing, or a gravel layer. It holds water above it and drowns the root, even if the surface is exemplary |
| Roots of the previous crop that stop abruptly at one depth | The plant has already shown it. That is where the obstacle is: compaction, lack of oxygen, or a calcareous layer |
| White concentrations | A calcareous horizon or salts. An analysis for active calcium carbonate is called for; kiwifruit is among the species most susceptible to lime-induced chlorosis [6] [7] |
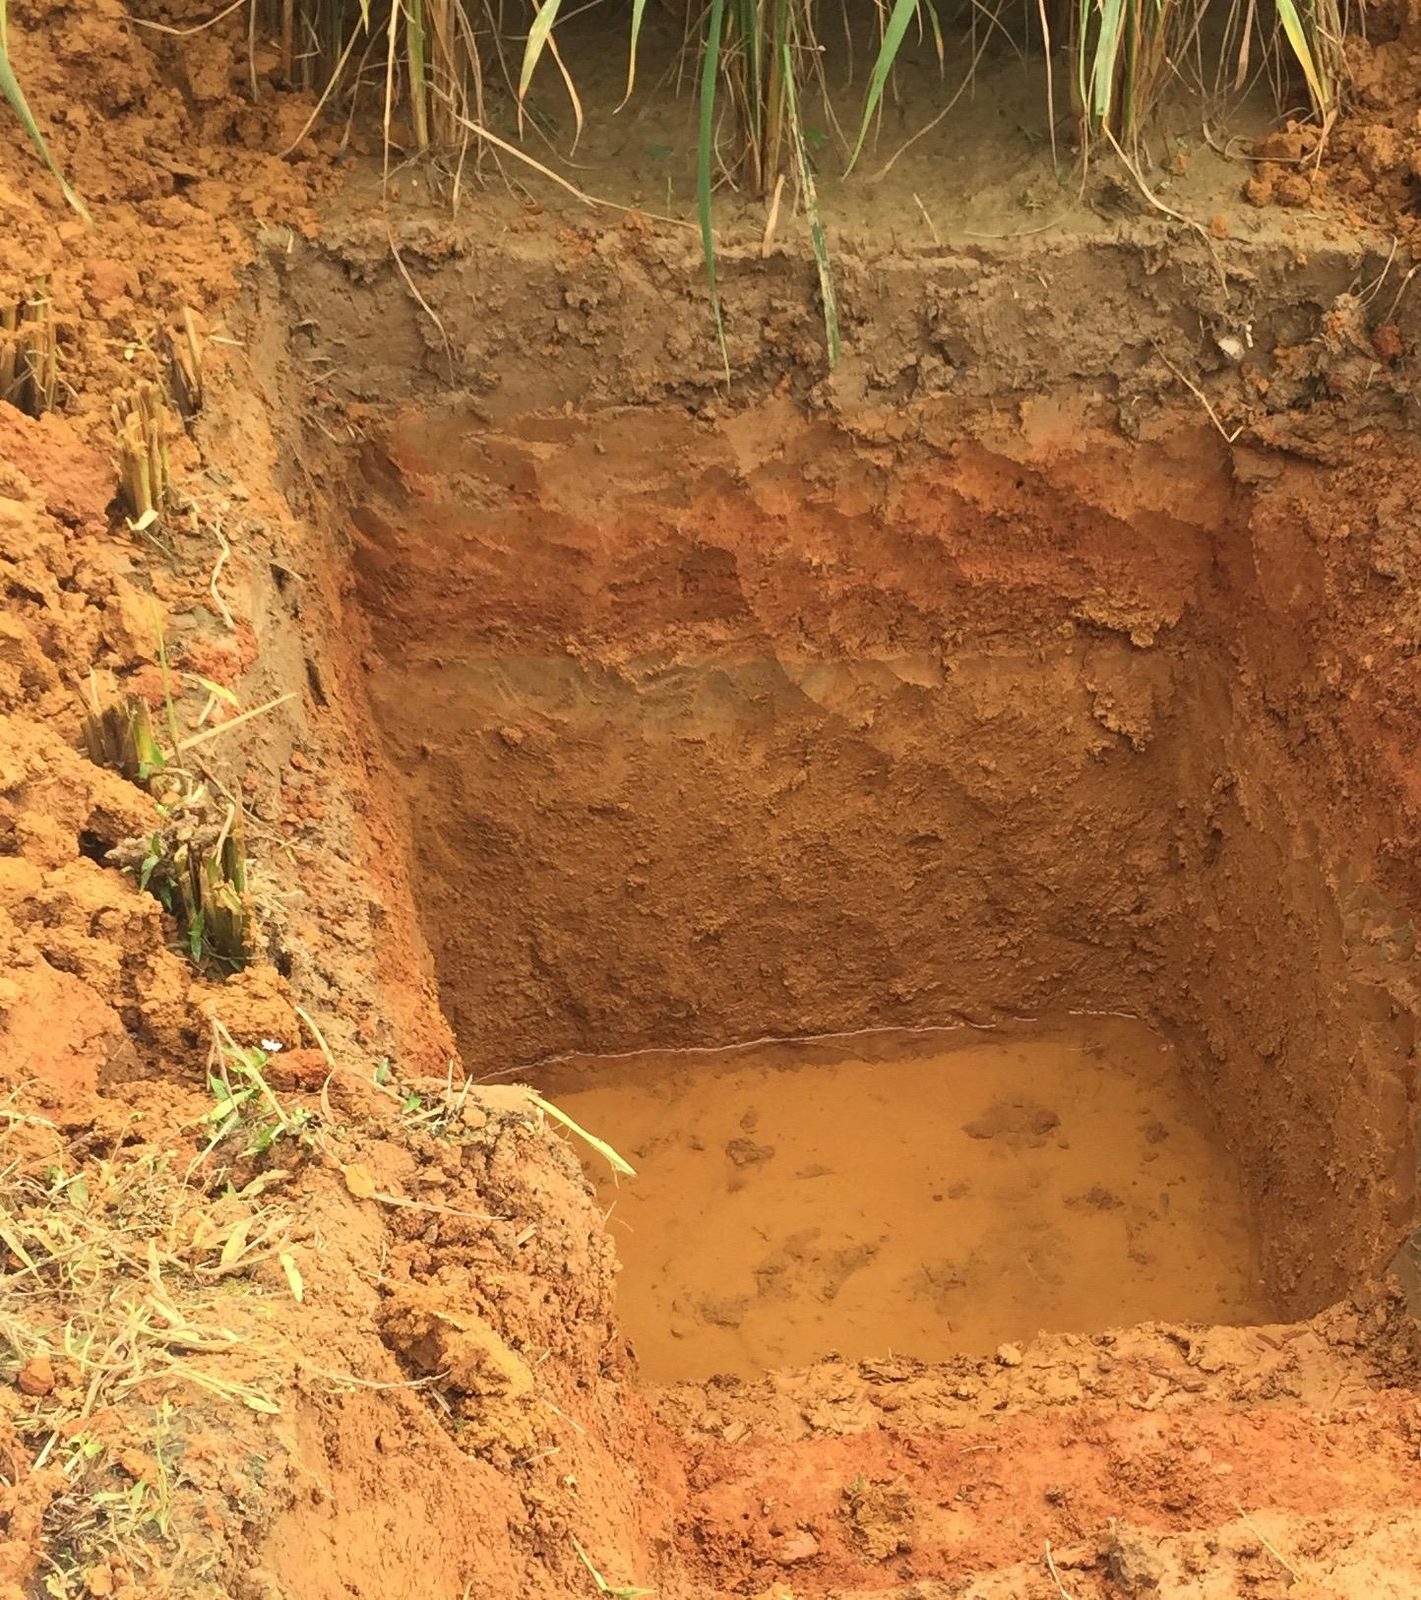
Figure 2. The soil pit is the only method that shows what lies beneath the surface. Whatever is not visible here, no chemical analysis will catch. Photograph: Savvas Pastopoulos.
3. Ring infiltration test: how fast water enters
This is the standard measurement of the infiltration rate at the surface, that is how many millimetres of water enter the soil in one hour. The method is simple and is described in detail by the FAO [1].
The method, step by step
- MaterialsTwo rings, 30 centimetres and 60 centimetres in diameter, a 2 kg hammer, a piece of wood so the ring is not struck directly, a millimetre rule, a bucket, a watch, a piece of hessian, and at least 100 litres of water [1].
- PlacingThe 30 cm ring is driven at least 15 centimetres into the soil, vertically. The rule is set so that about 12 cm remain above.
- The outer ringThe 60 cm ring goes around the first, or an earth bund is built to the same height. Its role is to stop the water moving sideways. Without it the measurement comes out falsely high.
- FillingWater into the inner ring to a depth of 70 to 100 millimetres, and the outer ring filled to the same height at the same time. Quickly. The hessian goes on the bottom so that the water does not scour the surface.
- ReadingsTime and level are recorded. Every 1 to 2 minutes at the start, the drop is noted and the water is returned to the original height. As time passes, the readings are spaced out to 20 to 30 minutes.
- EndThe test stops when the drop in level becomes the same over equal intervals. That is the steady rate. In the FAO example it stabilised at 27 mm/hour after 60 minutes [1].
- No outer ring or bund. The water escapes sideways and the block looks far better than it is.
- A single point. The FAO recommends at least two tests per location [1]. For a whole block, at least three locations are needed.
- Measuring in wet soil. The infiltration curve is determined under normal moisture conditions, before irrigation, with a dry surface [1]. A measurement the day after rain says nothing.
What numbers to expect
| Soil type | Basic infiltration rate |
|---|---|
| Sand | above 30 mm/hour |
| Sandy loam | 20 to 30 mm/hour |
| Loam | 10 to 20 mm/hour |
| Clay loam | 5 to 10 mm/hour |
| Clay | 1 to 5 mm/hour |
The values are the FAO's [1] and refer to a soil type in good structure. The actual number for a given block may be much lower within the same class, if the soil has been compacted, has lost its structure or has formed a surface crust [3]. Infiltration rate depends on both texture and structure [2]. That is precisely the value of the measurement: it gives the real figure, not the theoretical one.
4. Pit test: how fast it drains
The ring measures how fast water enters from the surface. The pit measures something different: how fast water leaves a given volume of soil, at the depth where the root will work.
They are worth keeping apart, because they answer a different question and one does not replace the other:
- The soil pit shows where and why the water moves or stops. It is qualitative: the layers, the colours, the pan and the roots are all visible. It gives no number.
- The pit test measures how fast water drains from a given volume of soil. It is quantitative: it gives millimetres per hour. But it does not show why it is slow.
In practice each completes the other. The test shows that the block drains slowly; the profile shows that the cause is the pan at 70 centimetres, and only the second piece of information allows a decision on whether it can be broken with a subsoiler or cannot be broken at all.
How it is done
- A pit is opened at least 80 centimetres deep, a metre is better, that is at the depth where the root will work.
- It is filled with water once and allowed to empty. That saturates the surrounding soil and is essential, otherwise what is being measured is dry soil soaking up water, not drainage.
- It is refilled with 30 centimetres of water and time and level are recorded.
- The drop is measured hourly at first and then every few hours. What matters is how long it takes to empty.
| Time for the 30 cm to empty | Average rate | What it means for kiwifruit |
|---|---|---|
| Less than 6 hours | above 50 mm/h | Excellent drainage. The block will not create an aeration problem |
| 6 to 24 hours | 12 to 50 mm/h | Acceptable. The block drains by itself |
| 24 to 48 hours | 6 to 12 mm/h | Marginal. It needs subsurface drainage, planting on ridges and strict discipline in irrigation |
| Not emptied in 48 hours | below 6 mm/h | Prohibitive without radical engineering intervention, and often with it too |

Figure 3. The pit test needs no equipment. It needs water, a watch and patience. It is the cheapest quantitative measurement that can be made before a twenty-year investment. Photograph: Savvas Pastopoulos.
The limits in the table are given as practical orientation indicators and do not replace a laboratory determination of hydraulic conductivity or a drainage design study. Assessment of a particular block is always made by on-site evaluation by an agronomist.
5. Observation pipe: where the water table is
This is the measurement that never gets made, because it requires patience: it does not finish in a day, it takes a winter. And it is the one that rules out most blocks on the plain.
It is not an instrument in the mechanical sense. The word comes from the Greek piezo, to press, and metron, measure. In hydrogeology a piezometer is a simple vertical installation in the soil that shows the height to which the groundwater rises, that is, the piezometric head, the pressure with which the water pushes upwards.
In its strict form, a piezometer is sealed along its whole length and open only at one specific depth. It therefore measures the pressure of one aquifer alone, without mixing in the ones above. It is needed when aquifers at different depths have to be told apart, or when the question is whether water is rising under pressure from below.
For this particular job the simpler version is enough: an observation pipe, perforated along its whole length, showing the free water table in the first few metres. That is exactly what is described below. In everyday usage it too is called a “piezometer”, which is not wrong, but a reference to a piezometer at a specific depth means something more specialised.
The cheap observation pipe
- Two or three perforated pipes are installed, a plastic pipe with holes, wrapped in geotextile, is enough, to a depth of 1.5 to 2 metres, at the lowest points of the block.
- A cap on top, so that rainwater and soil do not get in.
- The reading is taken with a rod or a weighted string, once a month, all winter. And without fail one or two days after heavy rain.
- A record is kept: date, rainfall, depth of the water table from the surface. One year of readings costs very little and forestalls a twenty-year decision.
And the free substitute: the rusty mottles in the soil pit. The depth at which they begin shows, with no waiting at all, how high the water reaches in wet years.
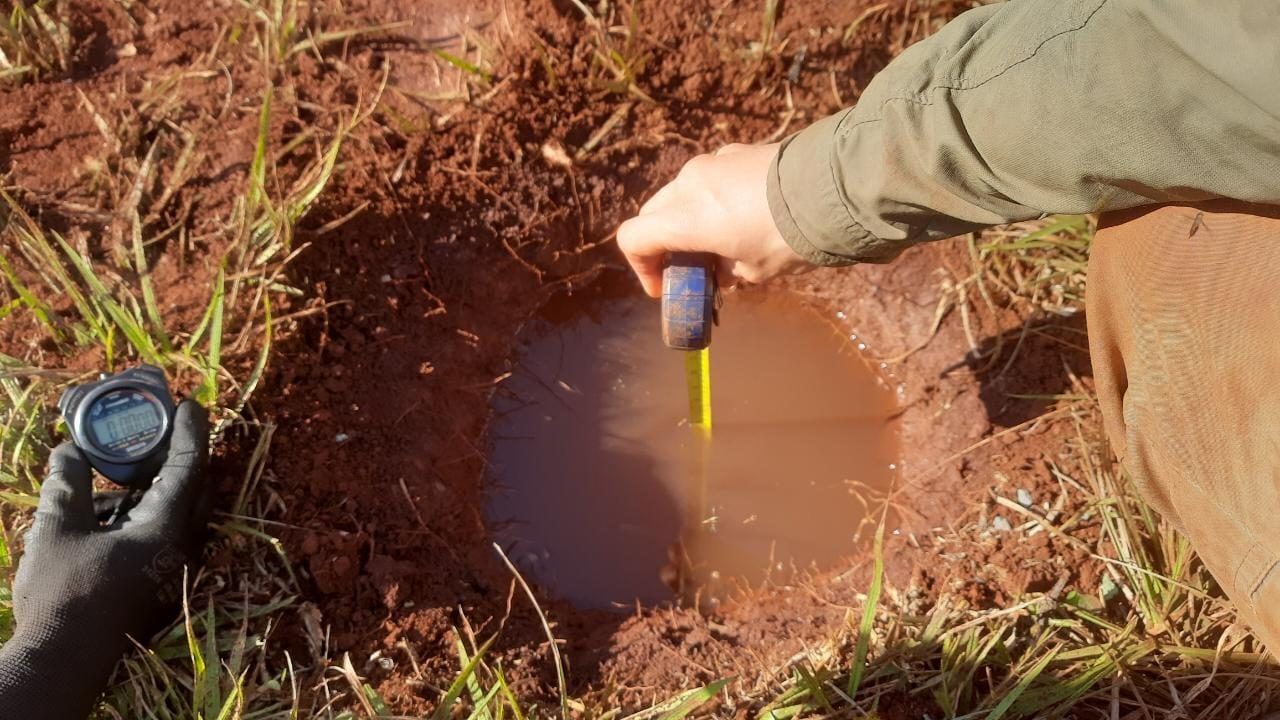
Figure 4. The water table and the drainage are judged in winter, not in August. A block that looks exemplary in August may have water at sixty centimetres in February. Photograph: Savvas Pastopoulos.
6. What the numbers mean for kiwifruit
Here the two figures come together: the infiltration rate and the five-hour rule. The question becomes concrete: a good 40 millimetres of rain, in how many hours will it have entered the soil?
| Soil | Infiltration | Time for 40 mm of rain | Against the 5 hours |
|---|---|---|---|
| Sand | 30 mm/h | 1.3 hours | Comfortably within |
| Sandy loam | 25 mm/h | 1.6 hours | Within |
| Loam | 15 mm/h | 2.7 hours | Within |
| Clay loam | 7.5 mm/h | 5.3 hours | At the limit |
| Clay | 3 mm/h | 13.3 hours | Outside |
The calculation is a simplification. The time water stands on the surface is not the same as the time the root spends in saturation. That is determined by the profile, the water table and the drainage, not by surface infiltration alone.
It does, however, show the order of magnitude clearly: on clays and clay loams, an ordinary autumn rain is enough to exceed the five-hour margin. And it explains why kiwifruit is so selective about the block, while the peach next to it is untroubled.
7. Why the dripper ponds: infiltration and irrigation
The infiltration figure has a second, everyday use that is seldom discussed: it explains why puddles form under the drippers.
A dripper delivers a given number of litres per hour at one point. If the soil cannot take them fast enough, the water spreads over the surface until it finds enough area, and if it does not find it, it ponds and runs off. The table below shows how large a circle is needed to avoid ponding:
| Soil | Infiltration | 2 L/h dripper | 4 L/h dripper | 8 L/h dripper |
|---|---|---|---|---|
| Sand | 30 mm/h | 29 cm | 41 cm | 58 cm |
| Sandy loam | 25 mm/h | 32 cm | 45 cm | 64 cm |
| Loam | 15 mm/h | 41 cm | 58 cm | 82 cm |
| Clay loam | 7.5 mm/h | 58 cm | 82 cm | 117 cm |
| Clay | 3 mm/h | 92 cm | 130 cm | 184 cm |
The required diameter of the wetted circle so that the dripper's discharge does not exceed the basic infiltration rate. Our own calculation, based on the FAO infiltration values [1]. It is indicative: in practice water also moves laterally within the soil, so the real tolerance is somewhat greater.
8. When, where and how many times the measurement is made
| Measurement | When | How many points |
|---|---|---|
| Soil pit observation | Any time, with dry soil so that the walls stand | 2 to 3, at different elevations |
| Ring test infiltration measurement | With a dry surface, before irrigation [1] | At least 2 per location, at 3 locations |
| Pit test drainage measurement | Any time, with prior saturation | At the worst points, not the best |
| Observation pipe water table measurement | December to March, and after heavy rain | 2 to 3 at the low points |
9. The decision
What all of the above is for is not a folder. It is one clear answer among three possible ones:
The water leaves on its own
Infiltration above 10 mm/hour, a pit that empties within 24 hours, a profile of uniform colour to two metres, a water table that does not approach the root in winter. The planting goes ahead.
The water leaves with engineering intervention
Marginal numbers, or an impermeable layer that can be broken. The following are needed, before planting and not after:
- Breaking the impermeable layer with a subsoiler, once, properly, with dry soil.
- Planting on ridges, so that the root rises above the critical layer.
- A subsurface or open drainage network, and the critical part: with a clear outlet. Without an outlet, drainage is decorative.
- Organic matter systematically, which is the one parameter that genuinely improves over the years.
- Minimising passes on wet soil, with fixed traffic lanes.
The water does not leave
A grey profile, a pit that does not empty in 48 hours, or a water table that rises seasonally into the rhizosphere. Here the question of cultivar and rootstock does not even arise. The block will comfortably carry another crop. It will not carry kiwifruit.
10. Sources
The numbers in the text refer to the list below.
- [1] FAO, Annex 2: Infiltration rate and infiltration test. Source for the definition of infiltration rate and the distinction between initial and basic infiltration, for the table of basic rates by soil type (sand above 30, sandy loam 20 to 30, loam 10 to 20, clay loam 5 to 10, clay 1 to 5 mm/hour), and for the full methodology of the test with 30 and 60 centimetre rings, including the requirement for at least two tests per location and for measurement on a dry surface before irrigation.
- [2] FAO, Irrigation water management: Soil and water and FAO, Field measurements. Sources for the relationship between texture, structure and water movement in the soil, and for the field measurements.
- [3] USDA Natural Resources Conservation Service, Infiltration (Soil Health Guide). Source for the effect of compaction, surface crusting and loss of structure in reducing infiltration rate relative to the theoretical value for the soil type.
- [4] Xiloyannis, C. and Xiloyannis, E. (2026). Georgia-Ktinotrofia, issue 04/2026. Source for the high root density of kiwifruit, for the fact that the intercellular space of its roots is barely 2% of their volume against 7% to 11% in peach and citrus, and for the five-hour rule for oxygen depletion in saturated soil.
- [5] Studies on the aetiology of kiwifruit decline: interaction between soil-borne pathogens and waterlogging. Plant and Soil (2020). Source for the higher incidence of the syndrome on silty soils with poor drainage, for the role of machinery compaction, and for the record of cases even on well-drained soils and in plantings on ridges.
- [6] Beutel, J.A., Kiwifruit. Small Farm Center, University of California, Davis. Source for the general soil requirements of kiwifruit and for the comparison of loam and sandy loam soils.
- [7] The right soil for growing kiwifruit, plantprotect.gr. The framework this article belongs to: the limits for pH, calcium carbonate and conductivity, the USDA texture table, bulk density, the two metres free of an impermeable layer, the 24-hour rule and the three analyses before planting.
The methods, limits and calculations described are indicative orientation indicators and do not constitute a study or individual agronomic advice. The tests described give a useful picture, but they do not replace a full soil and hydrological survey or the laboratory determination of hydraulic conductivity where that is required.
The suitability of a particular block is judged only after an on-site assessment by a licensed agronomist, with full soil and water analyses. Establishing a perennial planting is a twenty-year investment of substantial capital; every decision is taken at the user's own responsibility. Pastopoulos Agricultural Ltd accepts no liability for any damage arising from the use of the information in this text.
Related articles
Copper nanoparticles for kiwifruit bacterial canker
A Chinese study compared three copper nanomaterials with a conventional bactericide. On the plate they needed concentrations at least sixty four times lower. On the plant the control efficacies fell into the same range…
Training kiwifruit: T-bar and pergola
The architecture of the kiwifruit vine and why both training systems follow from it. T-bar and pergola with their dimensions, advantages, costs and a comparison in numbers. Training from the day of planting: planting high, a first season for the root with tipping at one metre, cutting back low the following spring and taking the trunk up in the second season, leaders, winter and summer pruning, males and the support structure. Three diagrams, a table of mistakes, and the gaps that remain for Greece. A field observation from Giannitsa on planting distances.
Chilling hours: the three models and when each one tells the truth
Chilling Hours, Utah Chill Units or Dynamic Chill Portions, what each measures, which suits which climate and season, why a chill portion does not convert into hours, and how the divergence between the three is read. The calculation itself lives in a separate tool.